Background
In 2019, eBay started an initiative to upgrade the monitoring platform to handle increased monitoring signals. We decided to make these upgrades in order to cope with the vast number of queries our system encounters, which in turn revealed several engineering challenges to be overcome. The new platform, Sherlock.io, aligns with the Prometheus tech stack, which is handling eight million time series signals per second and a total of one billion events per minute today. In addition to ingestion, storage and query layer, we decided to upgrade the anomaly detection module because the anomaly detection results that were provided by the previous monitor platform to site SEC/SRE received complaints due to noise and inaccuracy.
Univariate Algorithms
We revisited all of the use cases that have been used by the SEC/SRE. There were two categories of metrics that needed better algorithms:
Business metrics
These metrics, including listing number/minute, checkout number/minute and others are critical signals for eBay business. Most of them show a strong seasonality pattern.
Connection number for each VIP on LoadBalancer
These metrics show the number of queued up requests to different applications. If any issue like application performance saturation or network performance degradation occurs, this number spikes.
We decided to use new statistical learning algorithms to replace existing ones with the below considerations.
- Interpretability: Because of the critical nature of these metrics, they need to have solid interpretability so SEC/SRE is able to discern why an alert did or did not happen.
- Robustness: The previous anomalies or data missing should not impact future detection.
For business metrics, we initially tried several open-source algorithms, but found different drawbacks to each algorithm. This led to the creation of a home grown algorithm, called “Mediff.” Our paper “Anomaly Detection on Seasonal Metrics via Robust Time Series Decomposition” has more details.
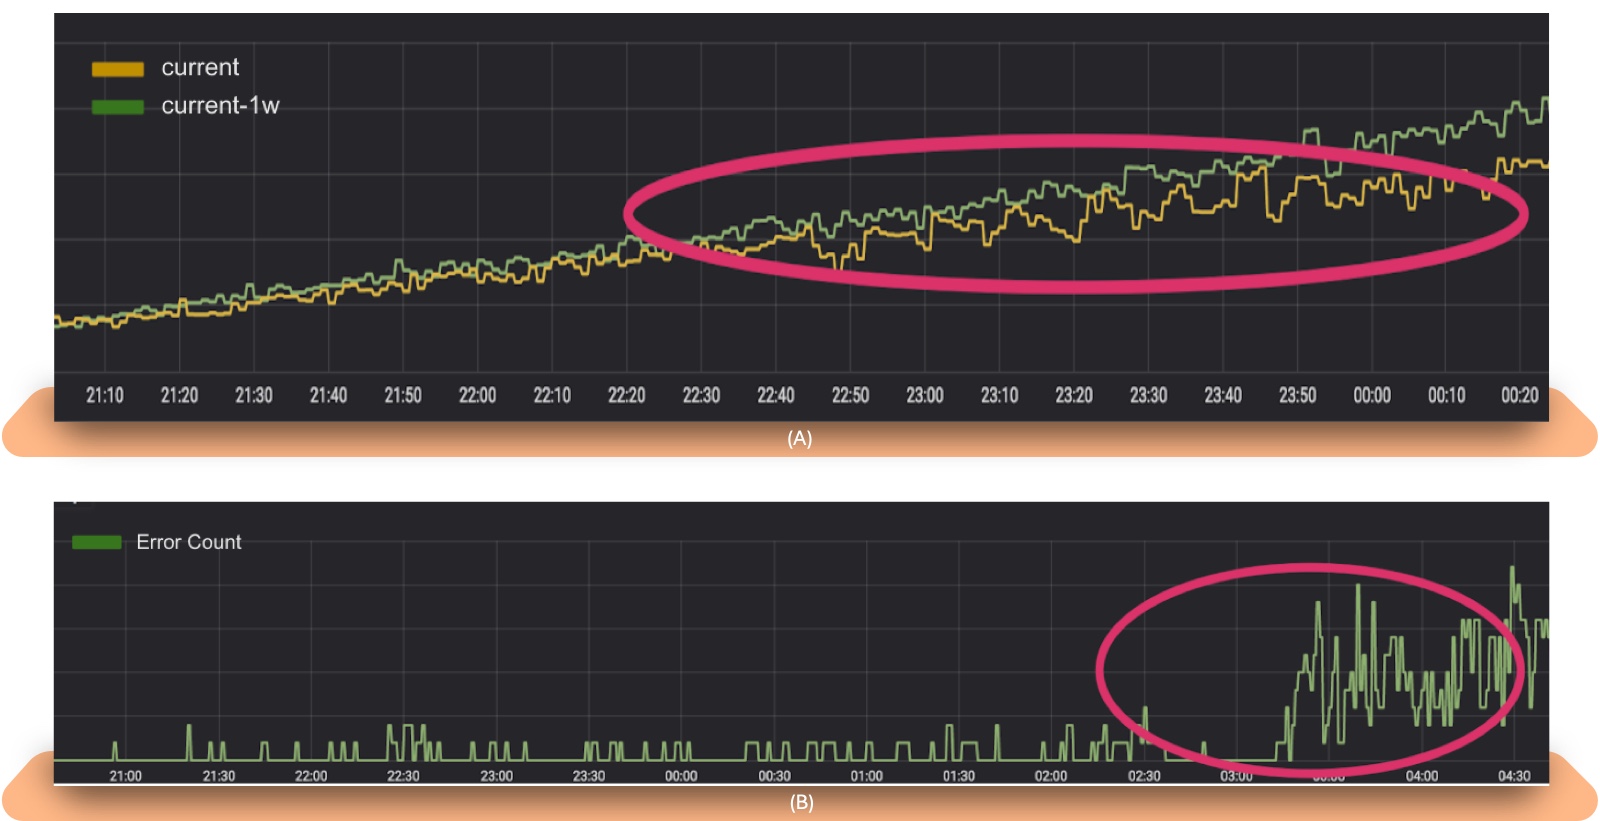
Figure 1: a) easy to tell alert reason 2) not impacted by data missing 3) not impacted by anomalies d) auto-adjust during daylight saving
The anomaly pattern of the load balance connection number metric is fairly simple: The spikes should be considered as anomalies. We defined the spikes as extreme values and applied the spot (“Anomaly Detection in Streams with Extreme Value Theory”) to this case. In order to adapt to the new VIP and traffic ramp-up scenarios, we modified the threshold t so the equation is changed to the one below:
We also applied this algorithm to detect application error spikes.
Engineering Work
DSL
Sherlock.io, the new monitoring platform, provides promql as the query DSL where the customers could use the promql to set up dashboards and alerts. We use the same DSL for anomaly detection. It is also convenient for customers to use, as they can use the same language to create dashboard and anomaly detection jobs. In addition, it gives some ‘dynamic’ capability so it is not necessary to set up an anomaly detection job for each of the timeseries. Taking the connection number of VIP as an example, there are many site-automated changes regarding VIPs: new application provisioned, application was sunset/decommissioned, VIP migrated to another Availability Zone due to network bandwidth and many more. It is difficult to set up anomaly detection jobs for each of VIPs. However, we can set up it by using below promql:
sum by (colo,application,Layer)(LbConnections{_namespace_="xxx",,probingEnv="Prod",LifeCycleState="LIVE"})
As long as the time series data is available in the platform, the anomaly would be detected.
Deployment Overview
We wrapped up the aforementioned algorithms into a service called Sherlock.io Insights. To leverage on the Sherlock.io platform capability to provide real-time anomaly detection, we used Prometheus Rule evaluator to trigger anomaly detection tasks where a customized function was added. For each metric that needed to be detected, we set up a recording rule. The Rule evaluator would query data points from the timeseries store and send them to Sherlock.io Insights by intervals defined in the rules. The results would be written back to the timeseriesstore as new time series where the alerting rules can be set up accordingly. This avoids the potential conflicts between ‘alerts from anomaly detection’ and ‘traditional threshold alerts.’ It also brings multiple benefits: Anomaly detection can reuse the existing platform alerting capabilities like debounce and notifications, and the customer has the freedom to set up alerts differently. For example, customer A can set up an alert rule that would send an email alert if there are 3 anomalies in the last 5 minutes, while customer B can set up an alert rule that would send an email alert if there are 5 consecutive anomalies.
 Figure 2: a) Deployment View b) Deployment View with Training
Engineering Challenges
We met two problems when putting the Sherlock.io insights into production to perform detection in real time.
- Query pressure to the timeseries store: The business metrics need to be detected every minute and they have strong weekly/monthly seasonality, so the Rule evaluator needs to query out weeks/months data from the timeseries store every minute. That means if we want to detect 1000 weekly pattern business metrics, the Rule evaluator needs to query out 1000*60*24*7*4(weeks) data points every minute.
- Computation pressure to Sherlock.io Insights service:There were nearly 50,000 VIPs in eBay production back in 2019, and the LB connection number of each VIP detection needs to be run every five seconds. The ‘spike pattern’ we defined in this case is ‘spike’ according to the last seven days. This means the calculation needs to be run over a fair amount of data every five seconds.
To relieve the query pressure, we separated the time series anomaly detection to have a training phase and an inference phase. We modified the algorithms to be incrementally trained. Aforementioned recording rules were kept as inference rules with much less query range (typically a two-hour time window). Using the above business metrics example, the Rule evaluator needs to query out 1000*60*2 data points every minute. The training phase is represented by another set of recording rules with bigger intervals (typically two hours) and a bigger query range (typically a 24-hour time window).
For LB connection number detection, we brought in T-digest to reduce the computation pressure so during the training phase, it would calculate threshold t. In the inference phase, the calculation would need to be run over in smaller amounts of data.
An example training rule:
{
  "name": "Android_conversion_pretrain",
  "enabled": true,
  "expr": "sherlockio_insight_call((sum by (_namespace_,__name__,app_id) (conversion_metric_name{_namespace_="namespace",app_id="Android"}))[1d:1m],"insights-training.vip/mediff/train","1d")",
  "type": "recording",
  "parallelism": 0,
  "interval": "2h",
  ...
}
An example inference rule:
{
"name": "Android_conversion_detection",
"enabled": true,
"expr": "sherlockio_insight_call((sum by (_namespace_,__name__,app_id) (conversion_metric_name{_namespace_="namespace",app_id="Android"}))[1d:1m],"insights.vip/mediff/inference","120m")",
"type": "recording",
"parallelism": 0,
"interval": "1m",
"labels": {
"__name__": "conversion_metric_name_detection",
"raw_metric": "conversion_metric_name",
"_namespace_": "namespace",
},

...
}
Post Release
Correlation by Rules
The LB connection number detection works well after we enable the solution in production, because the pattern is fairly simple. The business metrics, however, could only achieve roughly a 0.5 F1-score. This is mostly due to the twin freak problem from these algorithms in nature. In order to improve the accuracy with existing infrastructure, we again leverage on the Rule evaluator to encode SRE domain knowledge into the rules.
For example, if a checkout business dip and a checkout application error spike come together, it would become a high confidence alert.
 Figure 3: An example of correlation between two different type of anomalies
Small Deviation Problem
One type of the issue that the SEC has interests in is the problem we call “slow bleeding.” This type of problem is rare, but takes a long time to discover when it does occur.
We used adaptive cusum to solve this type of problem which proved to be very useful to catch such cases.
A Generalized Infrastructure
The methods we applied improved the accuracy of business metric alerting. The overall F1-score stays above 0.85 across all business domains in 2020.
We began to look at how to replace the threshold-based alert for system health that migrated from the old monitoring platform for several domains from late 2020. There are two typical use cases.
- Monitor system metrics per application including CPU, memory, service latency and error count. We call this one system health case.
- Check if the CPU and latency metrics per application in different regions behave the same pattern. We call this one colo-colo case.
The colo-colo case is a multivariate case because it needs to look at multiple time series at the same time. We think the system health should use multivariate algorithms, as it makes more sense to look at them together to show the health of the system.
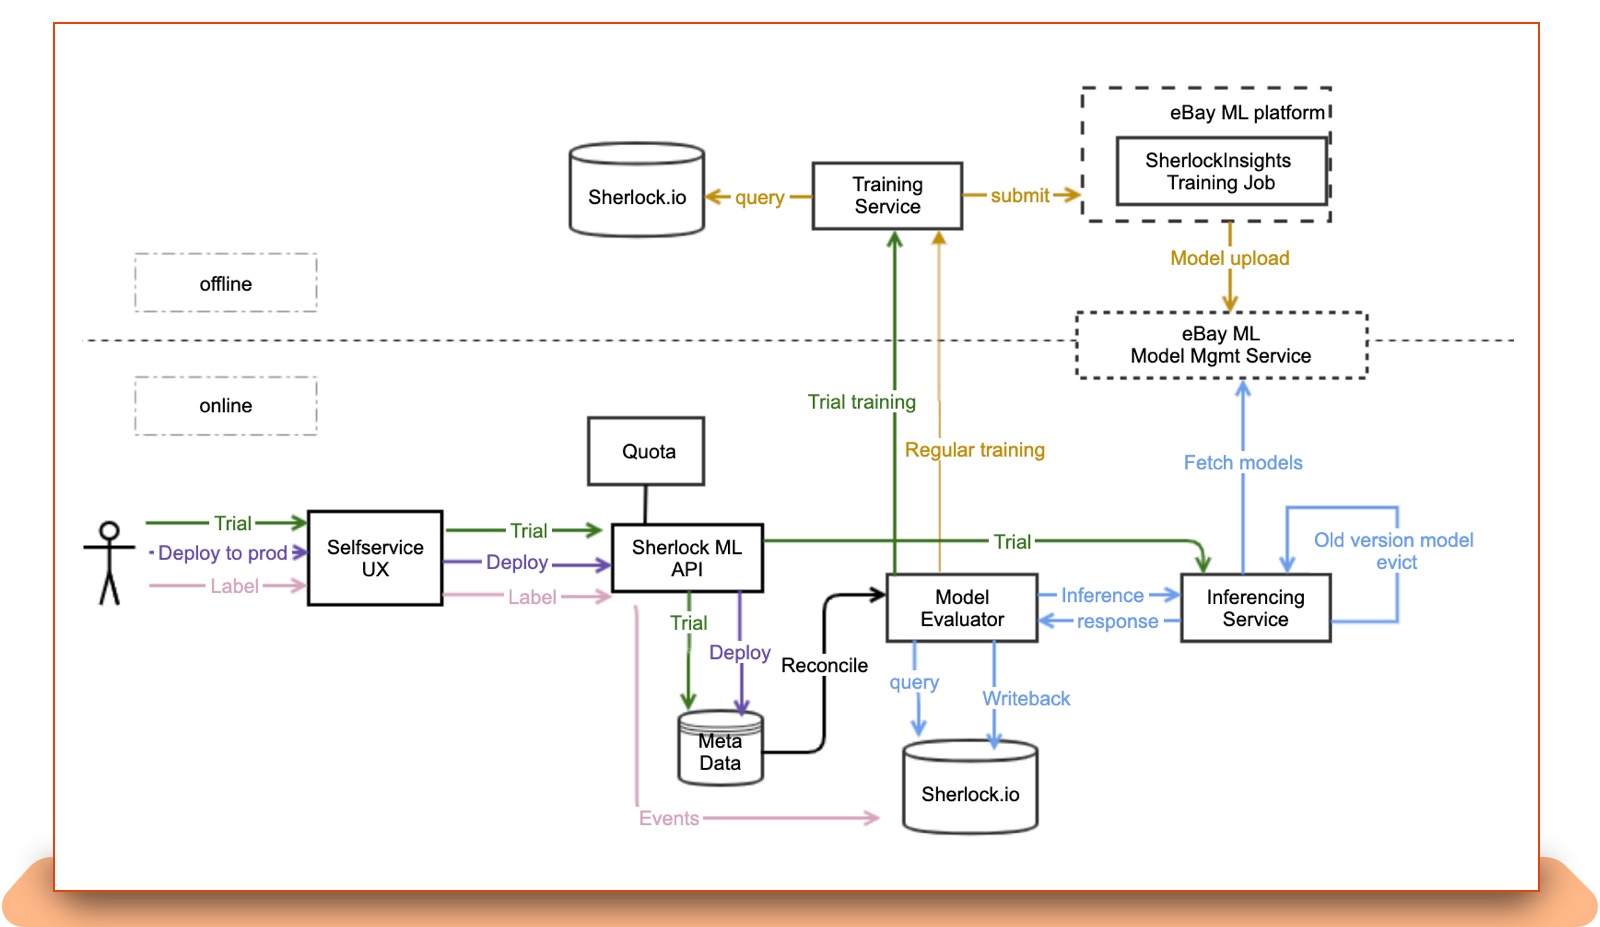
The infrastructure that we built on the top of the Rule Evaluator is not friendly to multivariate, as one recording rule can only contain one time series expression. On the other hand, multivariate algorithms typically need more historical data, which would bring query pressure during the case onboarding. Meanwhile, we wanted to bring this capability to a wider audience so different eBay teams could use anomaly detection in the self-service manner. This led us to a new infrastructure, shown below.
The lessons learned from previous experience were built into this new infrastructure, including incremental training support and splitting the query to the store into small chunk size.
Multi-Purpose Algorithms
When building the aforementioned generalized monitoring ML platform, we categorized different use scenarios and provided one algorithm for each. The requirements from different teams for the same category are different. We treated those as variants and handled those differences in parameters to make it easy for our customers to self-service.
By late 2021, for univariate detection, we began to offer seasonality detection, local variation detection, spike detection and trend detection for self service. For multivariate detection, we began to offer Ymir for system health like scenarios, colo-colo for collinearitydetection and BCD for change/rollout detection for self-service.
 Figure 6: a) an example of Ymir detection on a search application b) an example of Colo-Colo detection on one application TPS of 3 regions
What’s Next
During the journey of building monitoring in intelligence, we learned many lessons, both in algorithm development and in engineering development. We plan to publish several articles accordingly, and we’re excited to share what we discover!


