This is the final installment of our two-part series on how eBay turned around an impeding staging environment into its biggest asset for developer productivity.
In our first article, we explored if staging should exist, and explained why we decided to pursue staging. We also outlined our problem statements and discussed how we addressed the first problem, which is data. In our final article, we’ll share the rest of our journey, starting with the infra instability problem.
Infrastructure
Unlike the data track, the infrastructure track was more objective. Primarily, because the needs were apparent, it was about two things — reliability and predictable performance. Stability was the key here. The staging infra should always be available, but more than that, it has to be consistently performant. We were determined to avoid scenarios where one part (a zone or a shard or a stack) of the environment is fast, and the other is unpredictable. We also did not want variances in how each application performed. The goal was to have a setup in which every application scaled based on its usage and guaranteed consistent performance numbers. We did a couple of things to achieve that.
Hardware Refresh
A complete, staging hardware refresh was long overdue, and this was a perfect opportunity.
To begin with, we scaled up the staging load balancers with new ones for optimal performance under varied loads. The existing load balancers were also decluttered by deleting unused objects, resulting in evenly distributed traffic rather than skewing a particular one. All firewalls associated with the staging access path were reconfigured or removed in some instances to enable the quickest network routing. These misconfigurations were earlier identified as choking points for staging traffic and the cause for intermittent network issues.
Following the load balancer upgrades, we added a brand new cluster of worker machines to support the organic growth of staging compute and provisioning needs. The cluster was part of a new Availability Zone (AZ) in our data centers. This AZ brings in the capability of scaling staging across multi-AZs/clusters, thus enabling better disaster recovery (DR) mimicking a typical production setup. All staging VM computes were flexed up to have minimum defaults to guarantee predictable performance. We also implemented auto flex up, which can add further computes based on application usage and traffic pattern.
Database hardware was among the most outdated in staging. Our data infra team did a phenomenal job migrating all DB hardware to the latest specs, similar to production. The databases included Oracle, MySQL and the entire portfolio of NoSQL databases. We immediately observed a notable difference in staging availability. In addition, a dedicated secure zone was set up for all PCI related DBs. The objective here was to keep it as close to production as possible.
Monitoring and Remediation
The idea here was pretty simple. We have state-of-the-art monitoring and remediation systems in production. The goal is to bring them over to staging. Few tools were already available, but lack of maintenance and firewall misconfigurations made them unreliable. The core team set out to identify all these gaps and develop solutions to address them. Some were straightforward, and others more nuanced. Most complexities were due to the zoning differences between the production and staging environments.
Fast forward today: We have the same set of tools in staging that can monitor various system health metrics, ranging from application errors to CPU, databases, network and much more. In addition to auto-alerting, we now have dedicated technical duty officers (TDOs) to monitor the staging health round the clock. They help in incident triage and bring attention to respective infra owners. There is no new learning curve since tooling is mostly the same between production and staging, and engineers can easily be rotated. The story is the same with auto-remediation, where a subset of incidents resolves automatically without manual intervention. Another ongoing task is to add more observability into the systems to enhance auto-remediation further.
Auxiliary Systems Parity With Production
For an online marketplace to be fully functional, it is just not the application servers and databases that need to be up and running. There is a whole set of auxiliary components that are pivotal for end-to-end operations. These include systems like Hadoop, Kafka, Pronto, Rheos and Elasticsearch to name a few. These systems lacked parity (and in some cases non-existence) between staging and production. As a part of the initiative, we secured resourcing from the system owners and worked with them to address the gaps. We were smart about only bringing parity when it made sense and not blindly replicating production in staging. For instance, not all Hadoop pipelines are required in staging. Some are based on customer behavioral data, which will not be helpful in a testing environment. Thanks to all our partners, we have attained a sufficient parity for developers to be productive in staging again. However, it is not 100% done yet and continues to be an ongoing activity. Hopefully, in the future, this will be a non-issue, where systems are first built in staging and then ported to production. We already see that happening for new systems.
Fighting Off Regression To The Mean
It is hard to build great systems but even harder to keep them great.
It is indeed one of the hardest things to do. Now that there is high-quality data and a stable infra, we potentially could solve the chicken and egg problem, i.e., ensuring application teams always keep their functionality up and running in staging. But there is an even more important question — how do we make sure that in a couple of years from now, the staging environment does not regress to the same state as it was when we started this initiative? This desire is what we meant to fight off regression to the mean. We tackle it with a multi-step approach.
Unlike production, staging does not have a steady inflow of traffic. Production has round-the-clock requests, and hence any broken functionality is immediately alerted and addressed. The functionality here refers to all customer and business use cases and not just infra availability. That is how production availability is measured and reported (e.g., 99.97%). Staging is different, though. Application teams deploy their new outgoing builds to staging and run the full integration test suite to verify functionality is intact. The build then proceeds to production. However, there is huge variance among applications on when the same integration suite will run next. Some apps deploy on every pull request, some once a day and a few others once a week. The integration tests execution follows the same cadence. Many teams have set up nightly or scheduled integration runs, independent of deployment, to ensure all tests pass and the app is in the desired state. In any case, there is a gap ranging from a few hours to a week between successive test runs, and that is a problem.
If functionality breaks between these gaps, it will only be discovered in the subsequent integration runs. The breakage can happen due to many reasons. For instance, an upstream service deployed new code to staging, which broke the functionality of a downstream service. However, the upstream service’s integration tests did not catch it — a very likely scenario when you have a dependency matrix with hundreds of microservices. Or, during the idle time gap, the application state gets corrupted, which did not trigger any system-level alerts but broke the functionality. There can be many other causes, and the next integration runs will almost always capture all of them. However, in between these gaps, functionality was broken, and as a result, the staging environment was not available. Even if this happens across a handful of applications, it will always end up with some part of staging not being available.
First Step
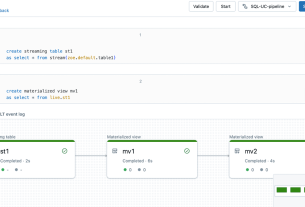
Fixing the gap uncertainty problem was the first step. To do that, we built a system called Smoke, which generates staging traffic 24/7. And the way it does that is by executing priority one (P1) and priority two (P2) integration test cases every 15 minutes across all applications round the clock. This is how it works.
- First, application owners annotate their existing P1 and P2 integration test cases in code that they want the Smoke system to pick and run. The key here is to use existing automation test cases and not create separate ones just for this purpose. A language-specific annotation syntax is published for developers to use. We only choose P1s and select P2s that are a good representation of functional availability rather than selecting the entire suite. The Smoke system does not verify a build’s readiness to deploy to production but rather an indicator of the functional stability of an application deemed critical. Also, we want the tests to execute quickly, as they have to repeat every 15 minutes.
- Teams then onboard the application to the Smoke system. It is part of our cloud console UI. For new apps, the onboarding happens during the app creation process itself. In this step, the system tries to detect all the dependencies of the application. It includes upstream dependencies, databases, auxiliary systems and underlying internal infra like GitHub, Maven, npm, etc. App owners can tweak the dependencies as needed to ensure correctness. Identifying the correct dependencies is vital to avoid false alerts (more on that below).
- Once dependencies are sorted out, the smoke system does a series of validity checks before traffic generation. The checks included things like verifying pager settings, so alerts go to the right teams. Verifying if the tests take less than five minutes to run, as anything more than that will cause a burden to the 15-minute repeats. If it has to be more than five minutes, the system recommends splitting into multiple jobs for the same app. Few other health checks like these follow suit.
- The final action is to enable traffic generation. Since the tests are integration tests, it is basically hitting HTTP endpoints for services or calling a grid for UI automation. As outlined above, these tests run every 15 minutes 24/7.
A representation of the Smoke system generating traffic 24/7
What happens when a test fails? It is the staging equivalent of a production incident. Though not as critical, it still impacts staging availability. We established a standard operating procedure (SOP) that mimics production but follows a different SLA that is pragmatic for staging. Staging tests will fail. It is expected, and that is the whole reason for the environment. We had to manage the failures efficiently.
 Triage workflow when an integration test fails
- The triage begins with the system identifying the root cause. If a service test fails, the dependency tree is traversed to check if any upstream components have also failed. The traversal goes all the way to the DB and infra pieces and identifies the last failed node as the cause for the incident.
- A pager alert is triggered to the on-call person of the identified service. The expectation here is to acknowledge the incident. Whether they act immediately or not depends on the situation. In the case of production, it is all hands on deck. For staging, if the alert comes in an off-hour, the team can decide just to acknowledge and fix it once back online. We want to avoid both a staging burnout and also not dilute a production alert.
- If a team has not acknowledged the incident within two hours, our technical duty officers (TDOs) get involved. We dedicated three TDOs just for staging monitoring in three time zones to cover a 24-hour cycle. They immediately start the investigation process leveraging the renewed tooling and reach the appropriate teams. The TDOs were one of the biggest differentiators in the triage process. They approach it holistically and hence prevent many incidents proactively.
- The triage ends with the owner(s) applying the fix. If it is app owners, they need to debug the test failures and fix them. If it is infra owners, they analyze why the associated health checks failed, which again is continuously monitored by the Smoke system, and address it. If a team acknowledges an incident but does not resolve them within 10 hours, the TDOs get on a call with them and work together to bring back availability. These timelines strike a good balance of giving teams enough time to fix and avoid slack.
Analyzing the root cause of test failures was the most challenging exercise. Initially, there were many false positives, and it created a lot of frustration for application teams. However, the Smoke team persisted and invested a ton of effort ranging from smart retries to handling timing-based race conditions to intelligent log analysis to pattern matching based on historical trends and drastically improved the system’s accuracy. When we began the traffic generation, 40% of alerts were false positives. Today, it is less than 2%. In the last three months alone, the total number of pager alerts has reduced by 15%, along with the average resolution times being halved — a good indicator that teams are deploying quality builds into staging. There is still a lot to improve, and the teams are working toward that, but we are happy with our progress.
Second Step
Creating the traffic generator system was the first step in fighting regression. The second step was to instill a sense of accountability, progress and north star for application teams to keep improving. For that, we set a 99% staging functional availability goal for each application. Though it does not guarantee that the overall staging availability will be at 99% (as that would mean that each domain should be at 99.89%), it was still an audacious goal. In other words, a domain can only have a downtime of approximately seven hours a month. Now that we have round-the-clock traffic, we collect and report these numbers during operational reviews with leadership. The intention of these reviews is not to question teams on the goals but to provide an opportunity to highlight obstacles that leadership can assist and share best practices. It also provides visibility to teams and motivates ownership of their availability numbers.
The progress has been tremendous. More importantly, teams have started taking staging seriously, making it a first-class citizen. We started with a couple of domains, and now the whole marketplace has signed up for the availability goal for all active applications. Below is a snapshot of the overall functional availability percentage a year back versus now. Even with increasing the number of applications and domain owners, the availability has steadily progressed over time.
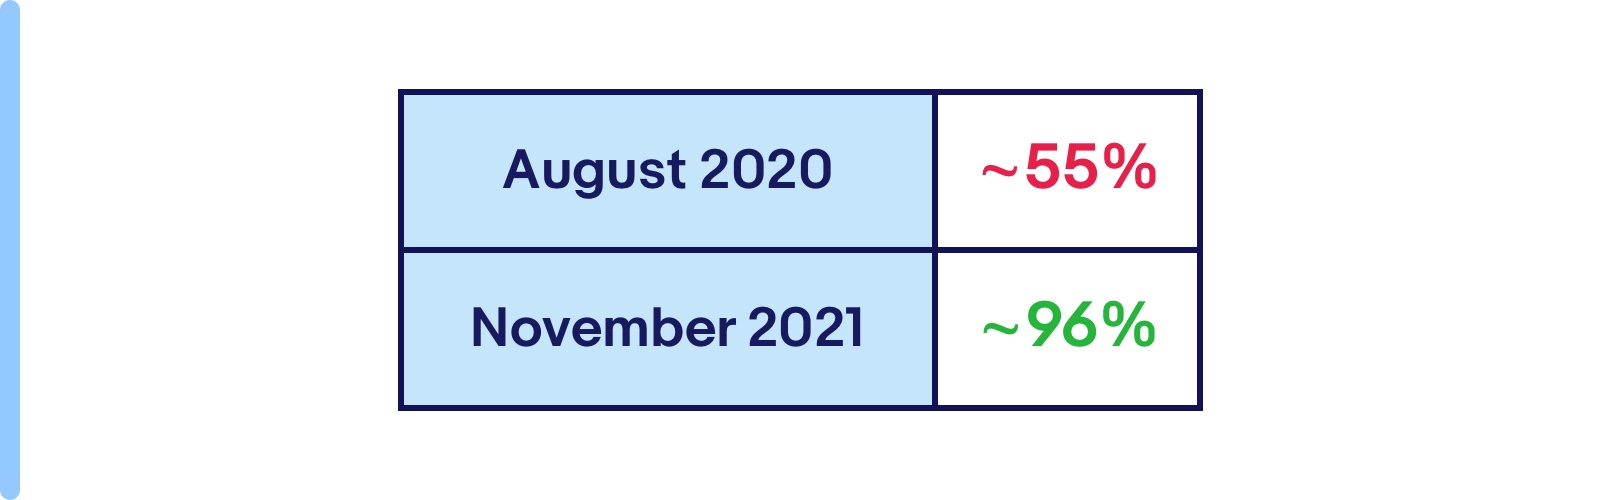
The staging availability was approximately 55% in August 2020. Today it is at 96%.
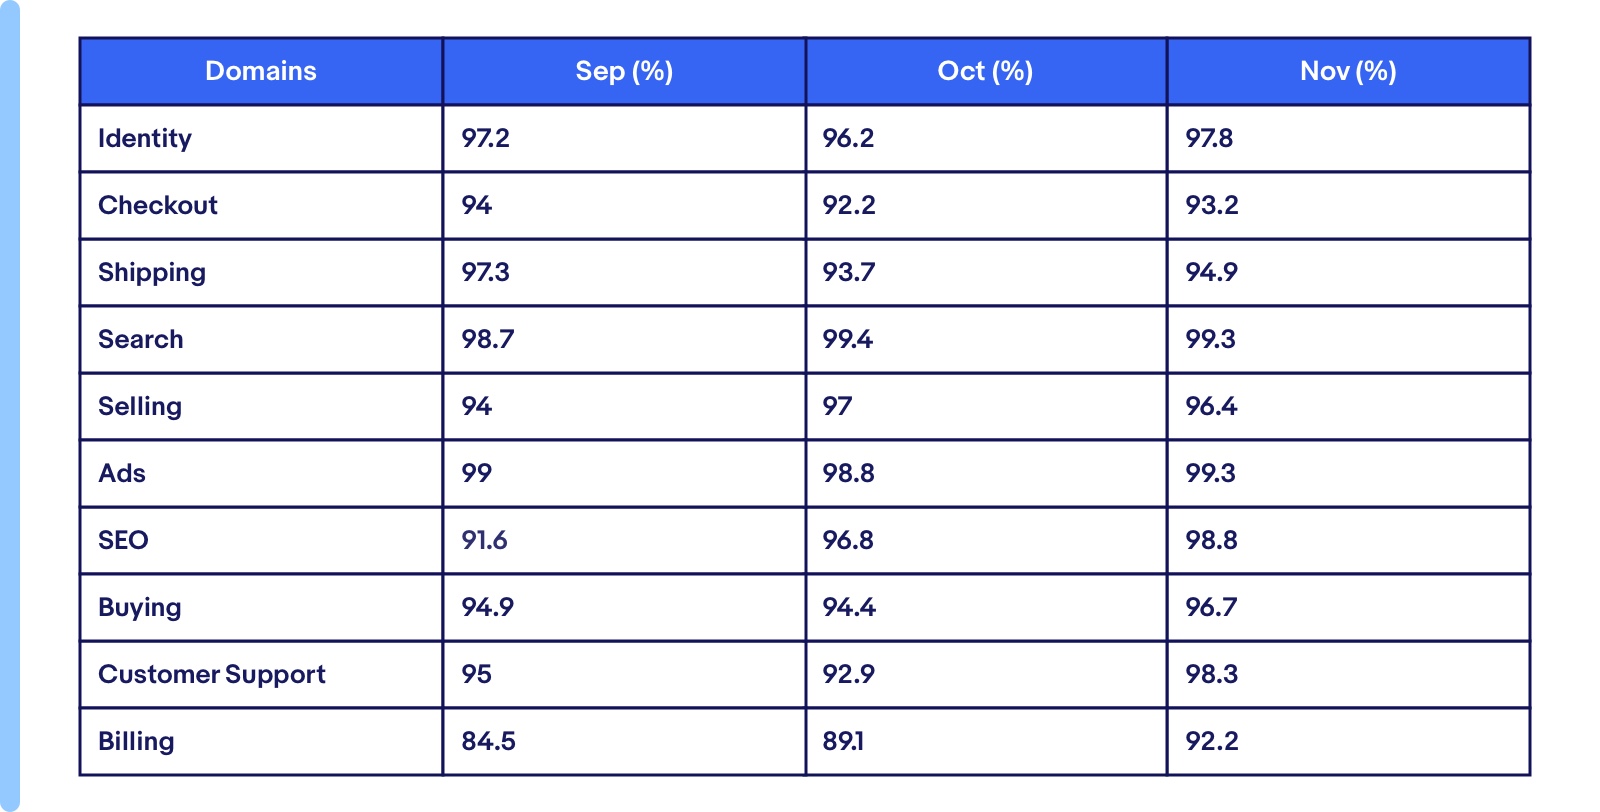
Domain-wise availability numbers for the last three months.
Virtuous Cycle
Our steps to resist complacency turned the original vicious cycle problem into a virtuous cycle. Now that staging is working in the way it ought to, developers started seeing a boost in productivity. What was once a frustrating and time-consuming experience has now become idyllic. The overall efforts provided the right tooling for rapid product development and instilled confidence, which was once lacking. The 99% goal setting was a starting point for teams to become serious. They are slowly thinking beyond the goal and are even more motivated to keep staging up and running. That was our intention all along. App owners see the benefits of how their upkeep helps other applications and vice versa.

The virtuous cycle of the staging ecosystem
As outlined in the diagram above, the three building blocks of the staging flywheel keep each other in check and strive for improvement. The high staging availability goal becomes a motivation to keep staging infra reliable and stable. The Smoke system exposes anything subpar. Considering the tight SLAs, the infra teams immediately address the concerns. Subsequently, for infra to be fully useful, it requires quality data. Which again becomes a motivation for the data pipeline to be on top of it. And with high-quality data, functional availability is even further improved. The cycle continues.
If a system just works, it blends in and becomes invisible. That is our ultimate goal for staging.
Wrapping Up
Today, 90% of all automated integration testing happens on staging. The pass rate is at 95%, compared to only 70% in 2020. Flaky tests are a big frustration point in software development. Even a minor improvement can have a multiplier effect, and we saw that with the jump in the pass rate. Also, in the past, teams pushed code to production with less confidence and executed a considerable number of sanity tests directly in production to validate functionality. Now that reluctance is gone. Only around 5% sanity testing happens on production, with the rest becoming integration tests executed on staging. Speaking about release velocity, we reduced our native app (iOS and Android) release cycles from three weeks to one week, and staging was a key enabler in achieving that.
It has been more than a year’s journey to get to where we are today. More than that, it has opened endless possibilities, and that is what keeps us excited. The staging core team’s commitment is to keep evolving the virtuous cycle and, in that process, find more opportunities to improve developer productivity. When our CEO prioritized tech-led reimagination as the path forward for eBay, his central theme was velocity. The whole leadership was aligned to remove every impediment in the way of developers, and this alignment accelerated the progress on staging.
So, coming back to the dichotomy that started all this, I think we now know the answer, and the impact has been profound.