The Databricks Container Infra team builds cloud-agnostic infrastructure and tooling for building, storing and distributing container images. Recently, the team worked on scaling Harbor, an open-source container registry. Request loads on Harbor are read-heavy and bursty and it is a critical component of Databricks’ serverless product – anytime new serverless VMs are provisioned, Harbor gets a large spike in read requests. With the rapid growth of the product, our usage of Harbor would need to scale to handle 20x more load than it could at peak.
Over the course of Q1 2023, we tuned Harbor’s performance to ensure it was able to horizontally scale out. Later we extended it with a new service called harbor-frontend to drastically improve scaling efficiency for Databricks workloads (read heavy, low cardinality of images).
Why Scale the Container Registry?
Databricks stores container images in Harbor. Whenever a customer starts up a Serverless DBSQL cluster, they reserve some amount of compute resources from a warm pool. If that warm pool becomes exhausted, our infrastructure will request additional compute resources from the upstream cloud provider (AWS, for example), which will subsequently be configured, started up, and added to the warm pool. That startup process includes pulling various container images from Harbor.
As our serverless product grows in scope and popularity, the warm pool will 1.) be exhausted more frequently and 2.) need to be refilled more quickly. The task was to prepare Harbor to be able to serve these scalability requirements.
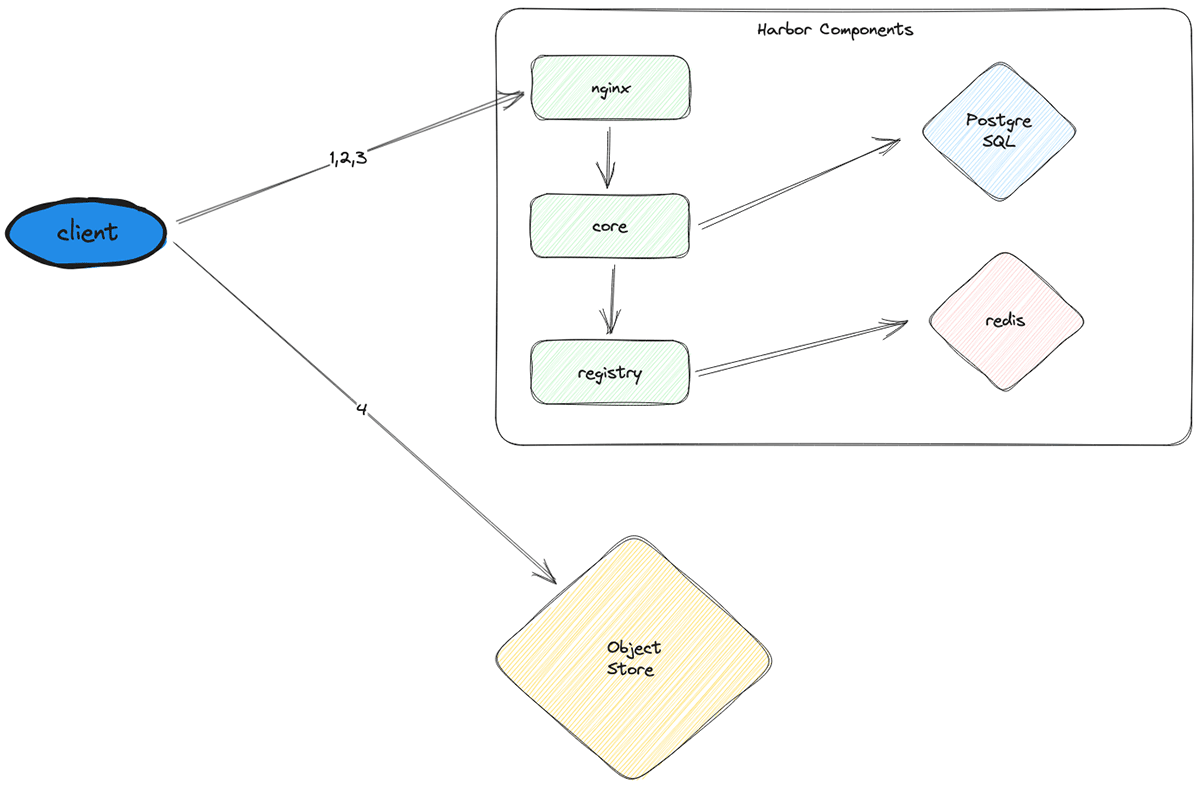
At a high level, image pulls for a node startup go through the following process:
- Authenticate the client node to Harbor
- Fetch the necessary image manifests from Harbor
- Based on the manifests, fetch signed URLs pointing to the corresponding image layers in object storage
- Use the signed URLs to pull all the image layers from external object storage (e.g., S3) and combine them to get the final images
Iterating Quickly
Before we started to improve Harbor’s performance, there were two things to understand first:
- What is meant by “performance”?
- How do we measure performance?
In the context of scaling Harbor for serverless workloads, performance is the number of node startups that can be served successfully per time unit. Each node startup must pull some number of images (roughly 30) from Harbor, and each image has some number of layers (roughly 10). So transitively, we can measure Harbor performance with the metric “layers requested per minute (LPM).” If Harbor can serve requests at 300 LPM, we can allow one node startup per minute.
Given our load forecast, the target was to enable Harbor to serve 1000 node startups per minute or 300,000 LPM. When I started, Harbor saw severe failure rate and latency degradation at 15-30,000 LPM. That meant we needed a 20x improvement in performance!
We spent the first month building up the tooling we’d use for the following three months: load-generation/load-testing. To measure Harbor’s performance, we’d need reliable testing to push Harbor to its limits. We found an existing load tester in the code base that could generate load on Harbor. We added docker packaging support to allow us to deploy it on Kubernetes and to ratchet up the load sent to Harbor by scaling it horizontally.
As we dove deep to understand the underlying process of Docker image pulls, the team crafted a new load tester which, instead of being bottlenecked by downloading from external object storage (Step 4 above), would only perform the steps that put the load on Harbor (Steps 1-3 above).
Once the latest load tester was built out, it was finally time to start improving our Harbor infrastructure. For distributed systems such as Harbor, this is what that process looks like:
- Apply load until the error rate and/or latency spikes
- Investigate to uncover the bottleneck:
- Error logs
- CPU usage
- Network connections
- CPU throttling
- 4xx/5xx errors, the latency on different components, etc.
- Resolve the bottleneck
- Return to Step 1
Through this process, we were able to identify and resolve the following bottlenecks quickly.
External Redis Cache Limits Image Pull Rate
The registry component had many instances, all calling into the same external Redis instance – to resolve this bottleneck we removed the external instance and made it an in-memory cache within the registry component. It turns out we didn’t need the external cache at all.
Database CPU spikes to 100%
To resolve this, we vertically scaled the DB instance type and limited the number of open connections each harbor-core instance made to the DB to keep connection creation overhead low.
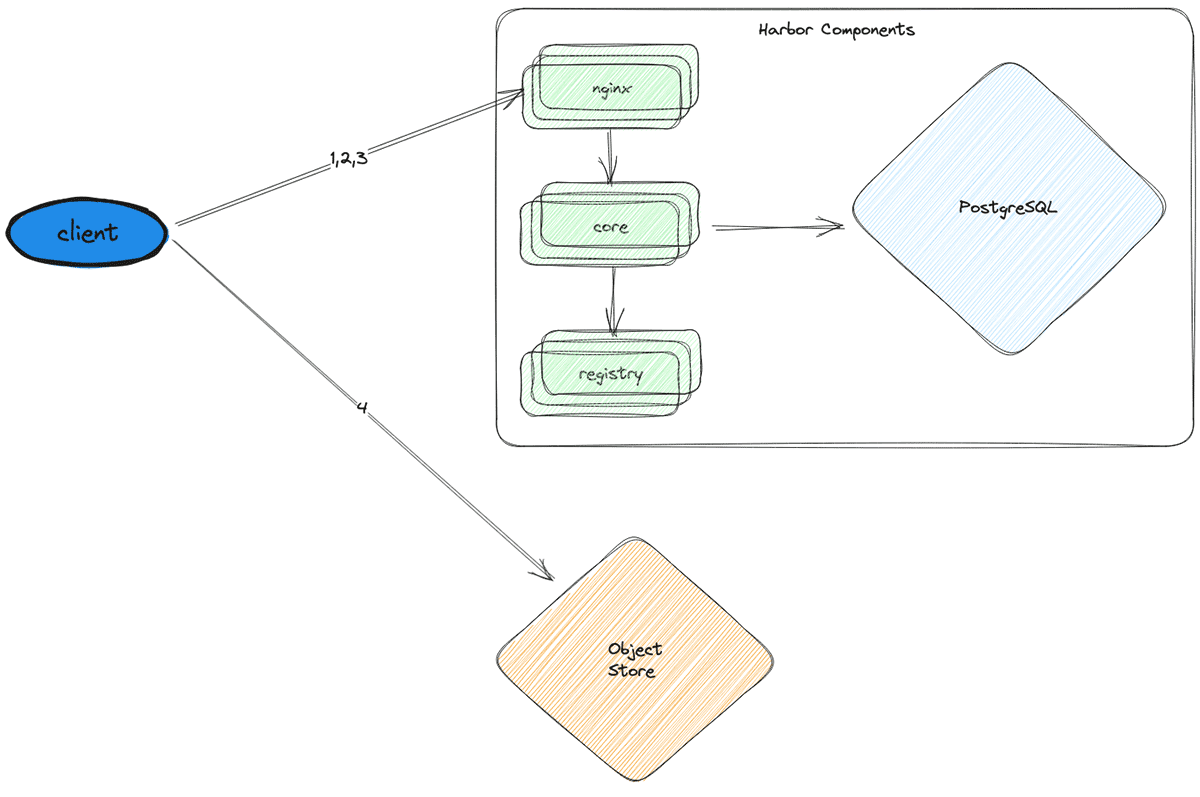
CPU throttling
Now that the DB was running smoothly, the next bottleneck was the CPU throttling occurring on the stateless components (nginx, core, and registry). To resolve this issue, we horizontally scaled each of them by adding replicas.
Finally, we hit the target of 300,000 LPM. However, at this point, we were using 30x more CPUs and a DB instance that was 16x more powerful and 32x more costly.
While these changes allowed us to hit our scalability target, they cost us millions of dollars more per year in cloud services. So we looked for a way to reduce costs.
Can We Sidestep the Problem?
To optimize, I needed to focus on the specific requirements of this use case. Node startups on the serverless product require only a small set of images to be pulled by a large set of nodes – this means we’re fetching the same set of keys over and over. A use case perfect for optimization via cache!
There were two options for caching: use something off-the-shelf (nginx in this case) or build something totally new.
Nginx caching is limited because it doesn’t support authentication. Nginx does not have a built-in authentication process that fits our use case. We experimented with different nginx configurations to work around the issue, but the cache hit rate simply was not high enough.
So the next option was to build something totally new – Harbor Frontend (Harbor FE).
Harbor FE acts as a write-through cache layer sitting between nginx and the other harbor components. Harbor FE is simply an HTTP server implemented in golang that authenticates clients, forwards requests to harbor-core, and caches the responses. Since all nodes request the same set of images, once the cache is warm, the hit rate remains near 100%.
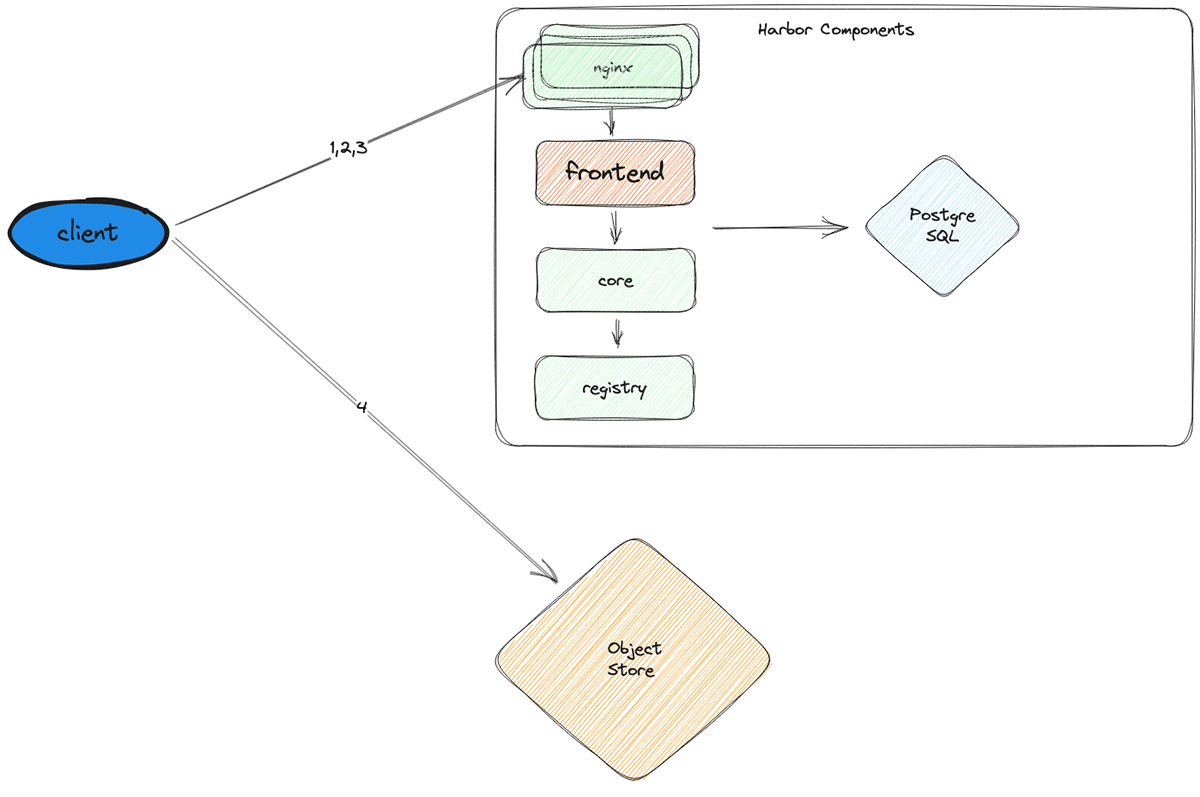
Using the new architecture, we’re able to significantly reduce load to other harbor services and the database (which is especially important since vertically scaling it is the most feasible option and is prohibitively expensive). Most requests terminate at Harbor FE and never hit harbor-core, harbor-registry, or the DB. Further, Harbor FE can serve almost all requests from its in-memory cache, making it a highly efficient use of cluster resources.
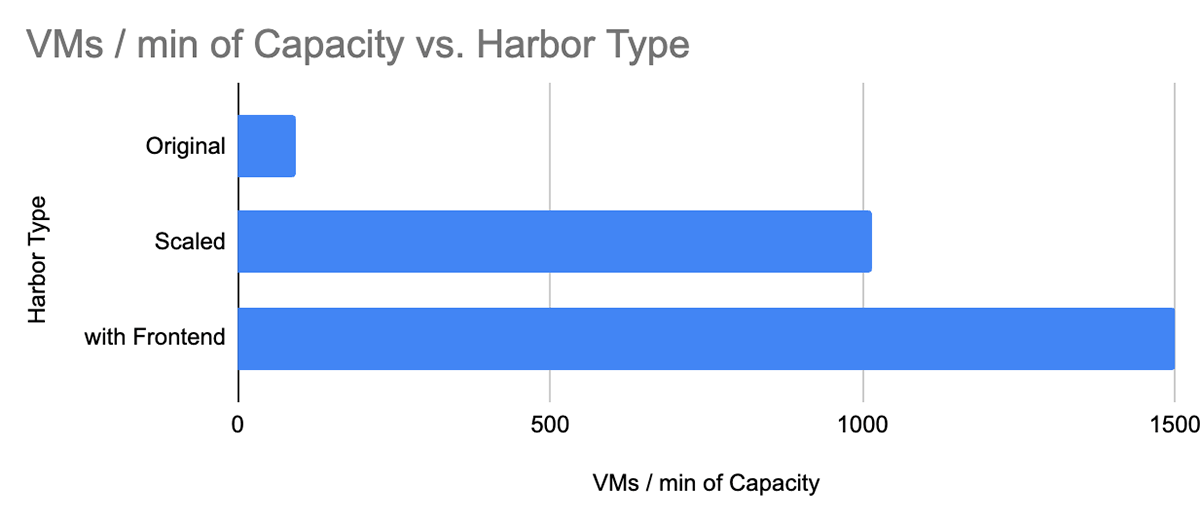
With Harbor FE, we were able to serve a capacity of 450,000 LPM (or 1500 node startups per minute), all while using 30x fewer CPUs at peak load than the traditionally scaled version.
Conclusion
In conclusion, the journey to improve Harbor’s performance at Databricks has been both challenging and rewarding. By using our existing knowledge of Docker, Kubernetes, Harbor, and golang, we were able to learn quickly and make significant contributions to the Serverless product. By iterating swiftly and focusing on the right metrics, we developed the `harbor-frontend` service, which allowed an effective caching strategy to achieve 450,000 LPM, surpassing our initial target of 300,000 LPM. The harbor-frontend service not only reduced the load on other Harbor components and the database but also provided additional benefits such as greater visibility into Harbor operations, a platform to add features to container infrastructure, and future extensibility. Potential future improvements include security enhancements, changing the image pull protocol, and implementing custom throttling logic.
On a personal note, before joining Databricks, I was told that the company takes pride in fostering a culture of high-quality engineering and promoting a supportive work environment filled with humble, curious, and open-minded colleagues. I didn’t know how true it would be until I joined the team in January, lacking knowledge of the tools necessary to interact with Harbor, let alone Harbor itself. From day one, I found myself surrounded by people genuinely invested in my success, empowering my team and me to tackle challenges with a smile on our faces.
I would like to extend my gratitude to my mentor, Shuai Chang, my manager, Anders Liu, and project collaborators, Masud Khan and Simha Venkataramaiah. Additionally, I want to thank the entire OS and container platform team for providing me with a truly wonderful internship experience.
Check out Careers at Databricks if you’re interested in joining our mission to help data teams solve the world’s toughest problems.