In a previous post, we introduced our systems for running marketing campaigns. Although we sent millions of messages daily, we had little insight into their effectiveness. Did they engage our users with our promotions? Did they encourage more transactions and bookings?
As Grab’s business expanded and the number of marketing campaigns increased, understanding the impact of these campaigns became crucial. This knowledge enables campaign managers to design more effective campaigns and avoid wasteful ones that degrade user experience.
Initially, campaign managers had to consult marketing analysts to gauge the impact of campaigns. However, this approach soon proved unsustainable:
- Manual analysis doesn’t scale with an increasing number of campaigns.
- Different analysts might assess the business impact in slightly different ways, leading to inconsistent results over time.
Thus, we recognised the need for a centralised solution allowing campaign managers to view their campaign impact analyses.
Marketing attribution model
The marketing analyst team designed a Marketing attribution model (MAM) for estimating the business impact of any campaign that sends messages to users. It quantifies business impact in terms of generated gross merchandise value (GMV), revenue, etc.
Unlike traditional models that only credit the last touchpoint (i.e. the last message user reads before making a transaction), MAM offers a more nuanced view. It recognises that users are exposed to various marketing messages (emails, pushes, feeds, etc.) throughout their decision-making process. As shown in Fig 1, MAM assigns credit to each touchpoint that influences a conversion (e.g., Grab usage) based on two key factors:
- Relevance: Content directly related to the conversion receives a higher weightage. Imagine a user opening a GrabFood push notification before placing a food order. This push would be considered highly relevant and receive significant credit.
- Recency: Touchpoints closer in time to the conversion hold more weight. For instance, a brand awareness email sent weeks before the purchase would be less impactful than a targeted GrabFood promotion right before the order.
By factoring in both relevance and recency, MAM avoids crediting the same touchpoint twice and provides a more accurate picture of which marketing campaigns are driving higher conversions.
While MAM is effective for comparing the impacts of different campaigns, it struggles with the assessment of a single campaign because it does not account for negative impacts. For example, consider a message stating, “Hey, don’t use Grab.” Clearly, not all messages positively impact business.
Hold-out group
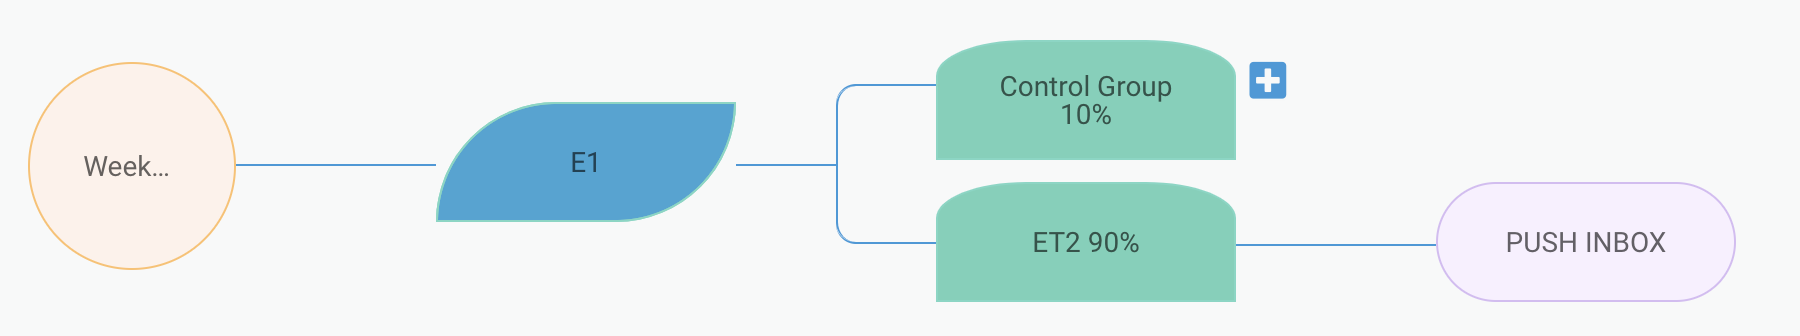
To better evaluate the impact of a single campaign, we divide targeted users into two groups:
- Hold-out (control): do not send any message
- Treatment: send the message
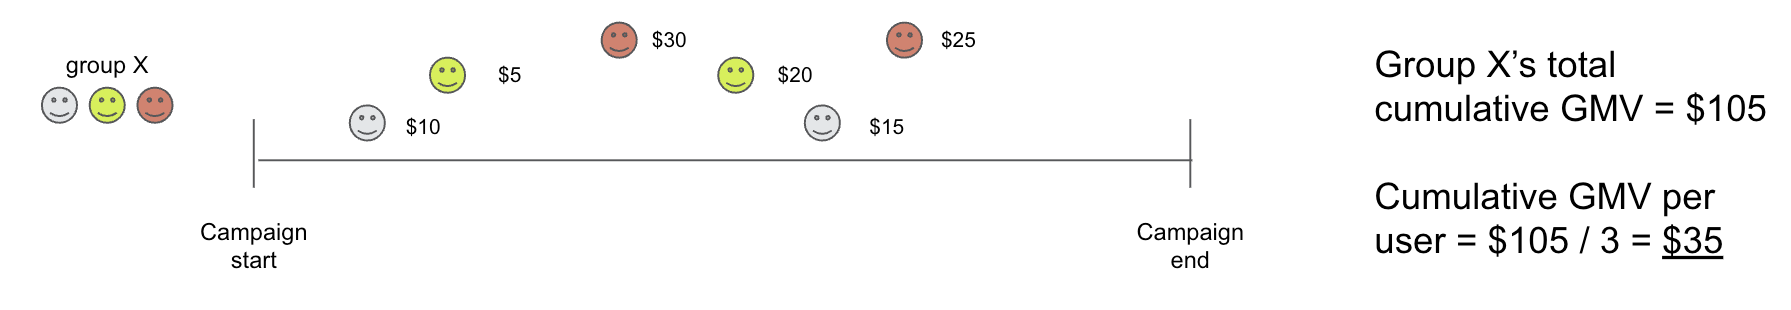
We then compare the business performance of sending versus not sending messages. For the treatment group, we ideally count only the user transactions potentially linked to the message (i.e., transactions occurring within X days of message receipt). However, since the hold-out group receives no messages, there are no equivalent metrics for comparison.
The only business metrics available for the hold-out group are the aggregated totals of GMV, revenue, etc., over a given time, divided by the number of users. We must calculate the same for the treatment group to ensure a fair comparison.
The comparison might seem unreliable due to:
- The metrics are raw aggregations, lacking attribution logic.
- The aggregated GMV and revenue might be skewed by other simultaneous campaigns involving the same users.
Here, we have to admit that figuring out true business impact is difficult. All we can do is try our best to get as close to the truth as possible. To make the comparison more precise, we employed the following strategies:
- Stratify the two groups, so that both groups contain roughly the same distribution of users.
- Calculate statistical significance to rule out the difference caused by random factors.
- Allow users to narrow down the business metrics to compare according to campaign set-up. For example, we don’t compare ride bookings if the campaign is promoting food.
Statistical significance is a common, yet important technique for evaluating the result of controlled experiments. Let’s see how it’s used in our case.
Statistical significance
When we do an A/B testing, we cannot simply conclude that A is better than B when A’s result is better than B. The difference could be due to other random factors. If you did an A/A test, you will still see differences in the results even without doing anything different to the two groups.
Statistical significance is a method to calculate the probability that the difference between two groups is really due to randomness. The lower the probability, the more confidently we can say our action is truly making some impact.
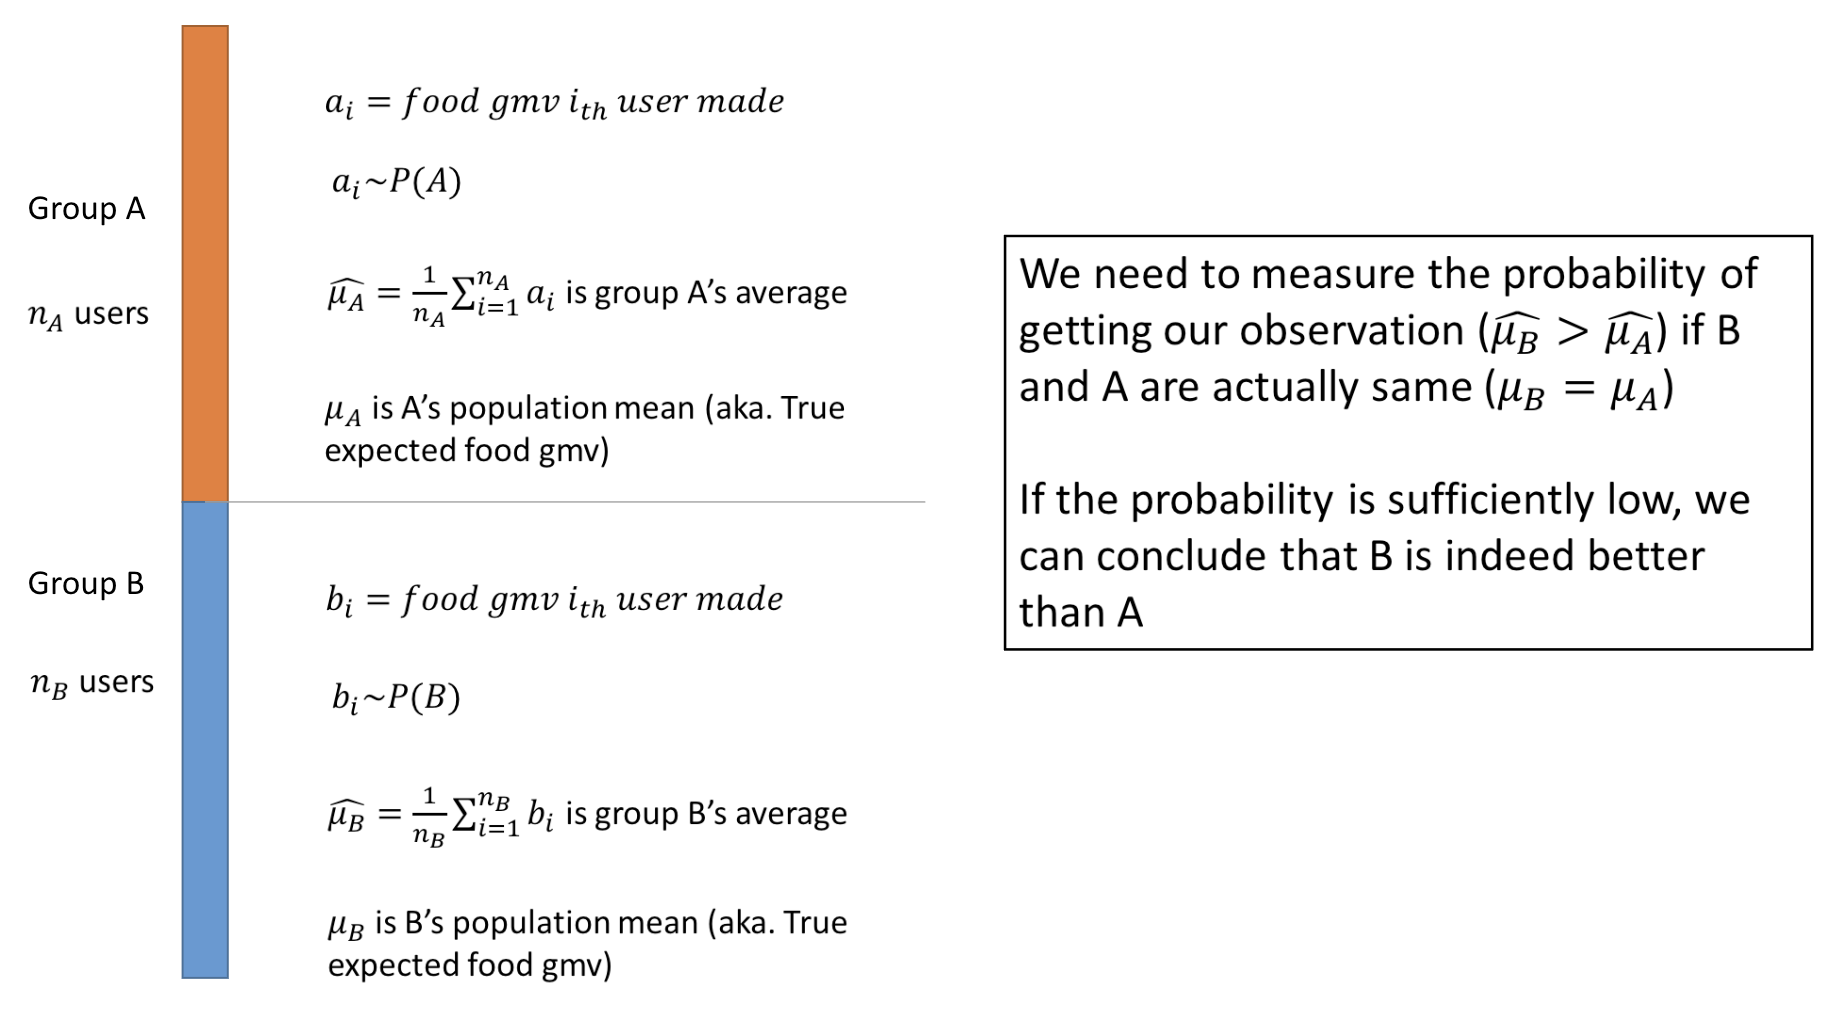
In our case, to derive statistical significance, we assume:
- Our hold-out and treatment group are two sets of samples drawn from two populations, A and B.
- A and B are the same except that B received our message. We can’t 100% prove this, but can reasonably guess this is close to true, since we split with stratification.
Assuming the business metrics we are comparing is food GMV, the base numbers can be formulated as shown in Fig 4.
To calculate the probability, we then use a formula derived from the central limit theorem (CLT). The mathematical derivation of the formula is beyond the scope of this post. Programmatically, we use the popular jStat library for the calculation.
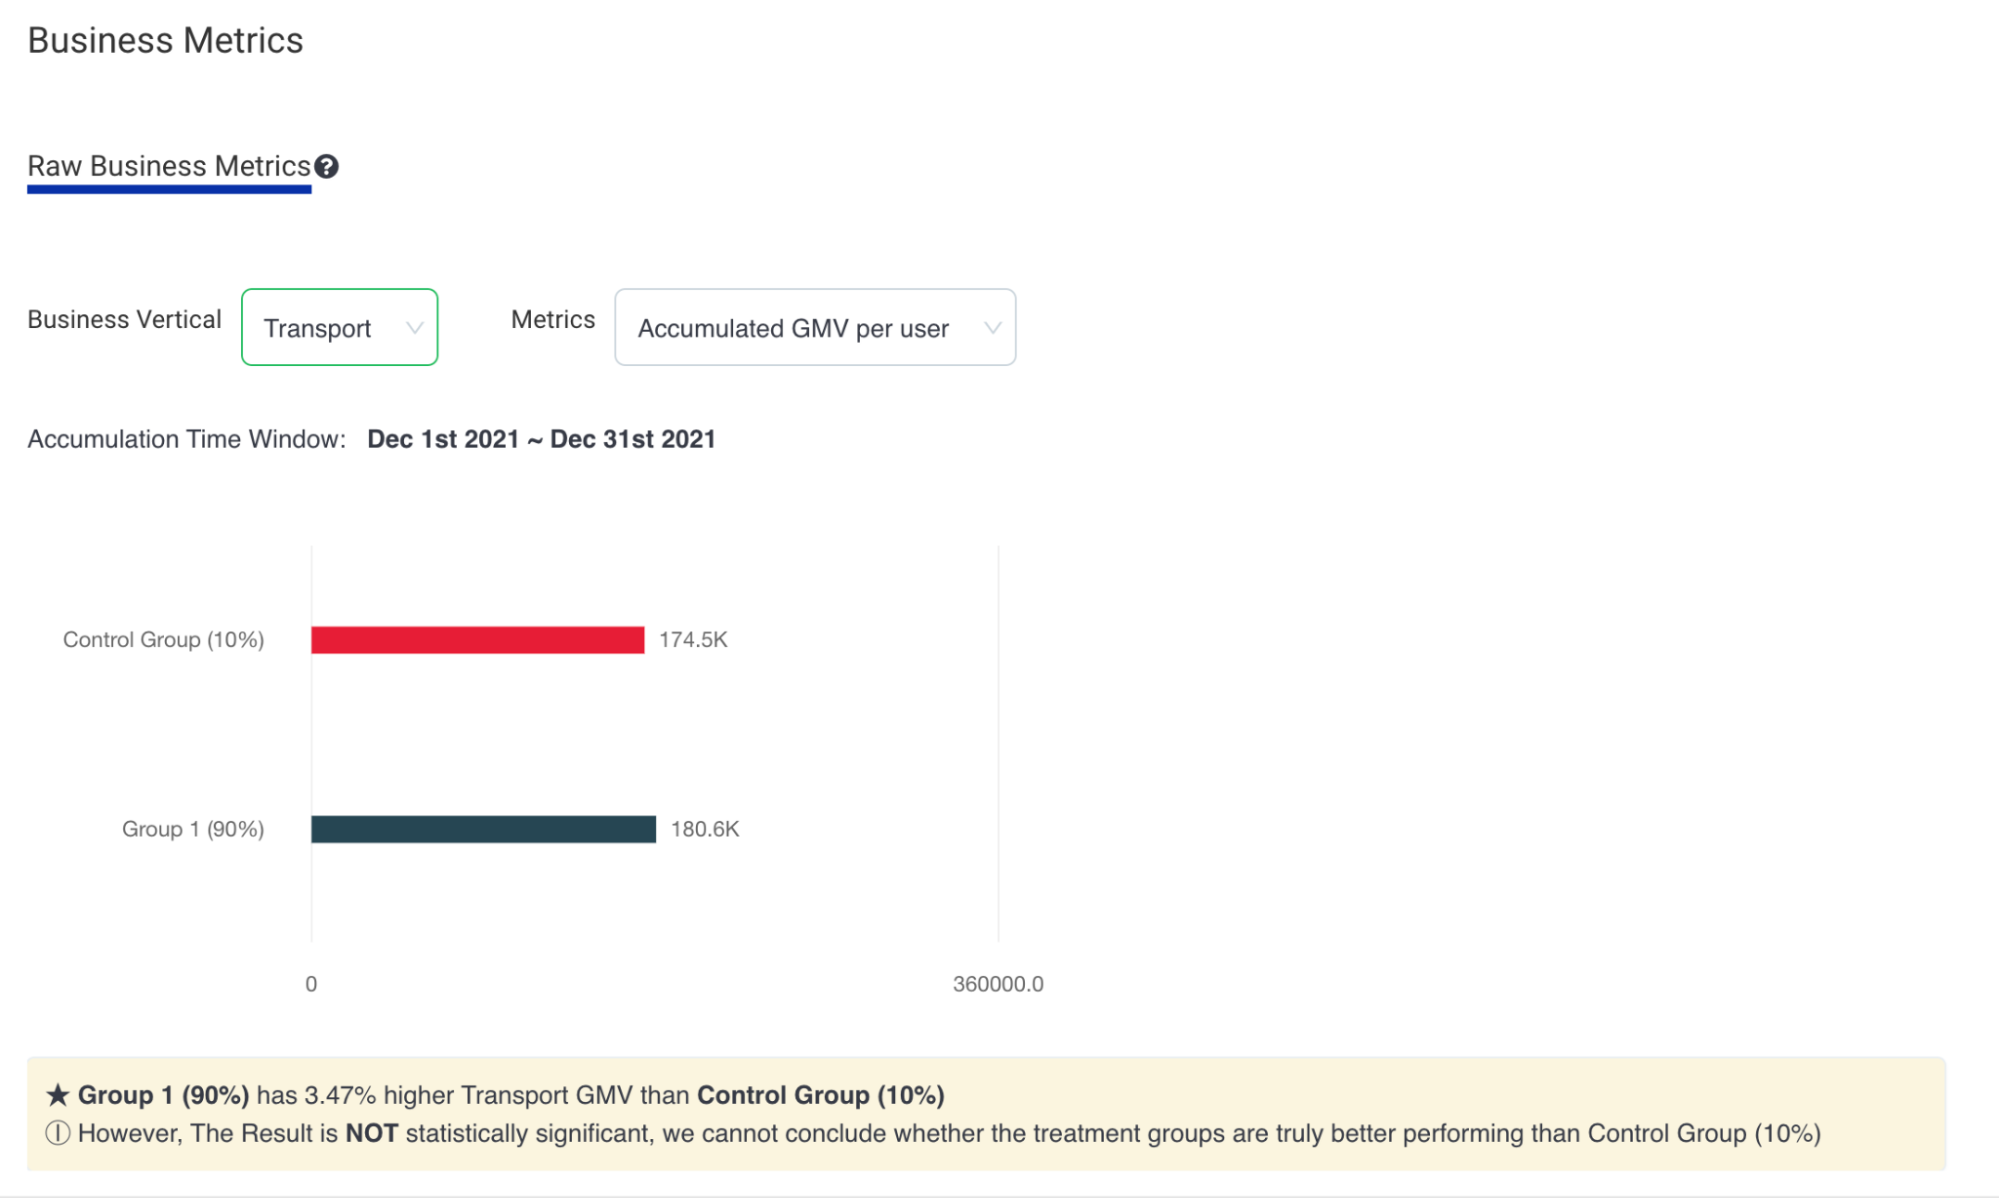
The calculation result of statistical significance as a special notice to the campaign owners is shown in Fig 5.
What’s next
Evaluating the true business impact remains challenging. We continue to refine our methodology and address potential biases, such as the assumption that both groups are of the same distribution, which might not hold true, especially in smaller group sizes. Furthermore, consistently reserving a 10% hold-out in each campaign is impractical for some campaigns, as sometimes campaign owners require messages to reach all targeted users.
We are committed to advancing our business impact evaluation solutions and will continue improving our existing solutions. We look forward to sharing more insights in future blogs.
Grab is the leading superapp platform in Southeast Asia, providing everyday services that matter to consumers. More than just a ride-hailing and food delivery app, Grab offers a wide range of on-demand services in the region, including mobility, food, package and grocery delivery services, mobile payments, and financial services across 428 cities in eight countries.
Powered by technology and driven by heart, our mission is to drive Southeast Asia forward by creating economic empowerment for everyone. If this mission speaks to you, join our team today!