How much carbon is stored in the aboveground biomass (AGB) of Wytham Woods aka the ‘most studied forest in the world’? Professors Mat Disney and Kim Calders thought this would be very well-known but were surprised to find this perhaps wasn’t the case after all. They discuss how their team approached their latest research.
Over the years, a number of studies have estimated the carbon stored in Wytham Woods, and many more have estimated carbon in UK woodlands more widely. These estimates generally all use empirical regression models relating tree diameter-at-breast height (DBH) (which is easy to measure) and biomass (which is not). These so-called allometric models are calibrated using harvest measurements of individual tree biomass i.e. cutting down and weighing the whole tree.
We had been using terrestrial laser scanning (TLS) at Wytham to measure the forest structure in detailed 3D in order to explore relationships of structure to function. We also wanted to estimate AGB, something we had done widely in other forests, including in the tropics.
Various studies have shown that TLS estimates of AGB agree very closely with destructive harvest mass. Of course in Wytham this wouldn’t show anything new as AGB was already so well-known – this was just a sanity check really. But the TLS-derived biomass was 80% higher than the allometric estimates.
Assuming we hadn’t made a mistake (always a possibility of course), we had effectively almost doubled the amount of carbon stored in Wytham Woods. What was going on?
Rewind 50 years
Around 50 years previously, Dr Bob Bunce, a young ecologist fresh out of his PhD, was working on a short-term contract to produce an allometric model to describe deciduous woodland trees.
In 1966 and 1967 he made painstaking harvest measurements of just over 200 trees, mostly birch and oak, along with ash, sycamore and lime, in sites dotted around upland areas of the Lake District. He found a very tight relationship with around 99% of the variance in AGB explained by DBH, as you can see below from one of his original figures.
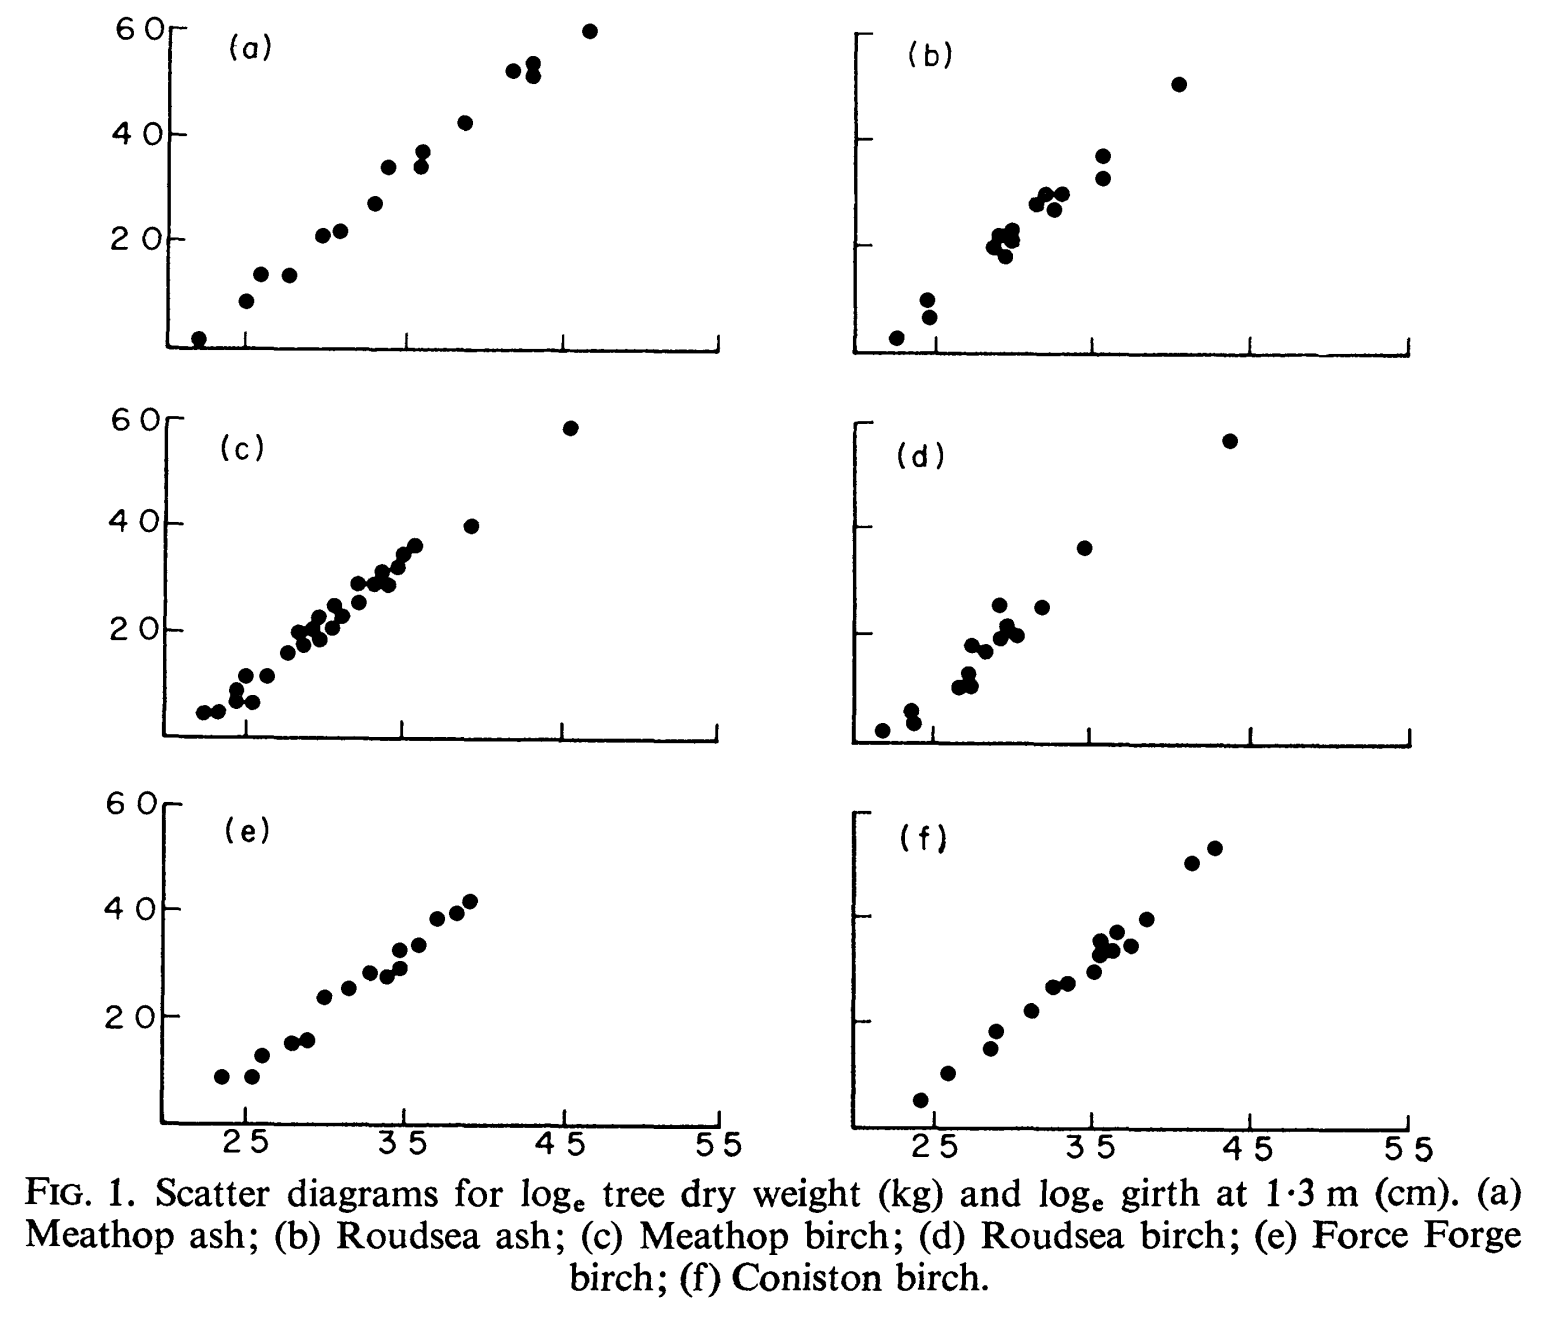
He published this in 1968, along with a caveat that the regressions varied between sites, elevation and tree size particularly, and were not likely to be more widely representative given the acidic soils, topography and management history of his sites.
Bob left this work behind and went on to become a highly respected woodland ecologist, leading the development of Britain’s Countryside Survey among many other things.
Finding Bob
We started looking into published estimates of Wytham tree carbon and they nearly all came directly, or indirectly, from Bob’s 1968 paper, sometimes at one or even two removes and generally for very different conditions and even species. We also found his model underpinned estimates of AGB more widely across deciduous woodland in the UK, as well as studies in Europe and the US.
We wondered if Bob Bunce knew about all this and if so what he thought about it.
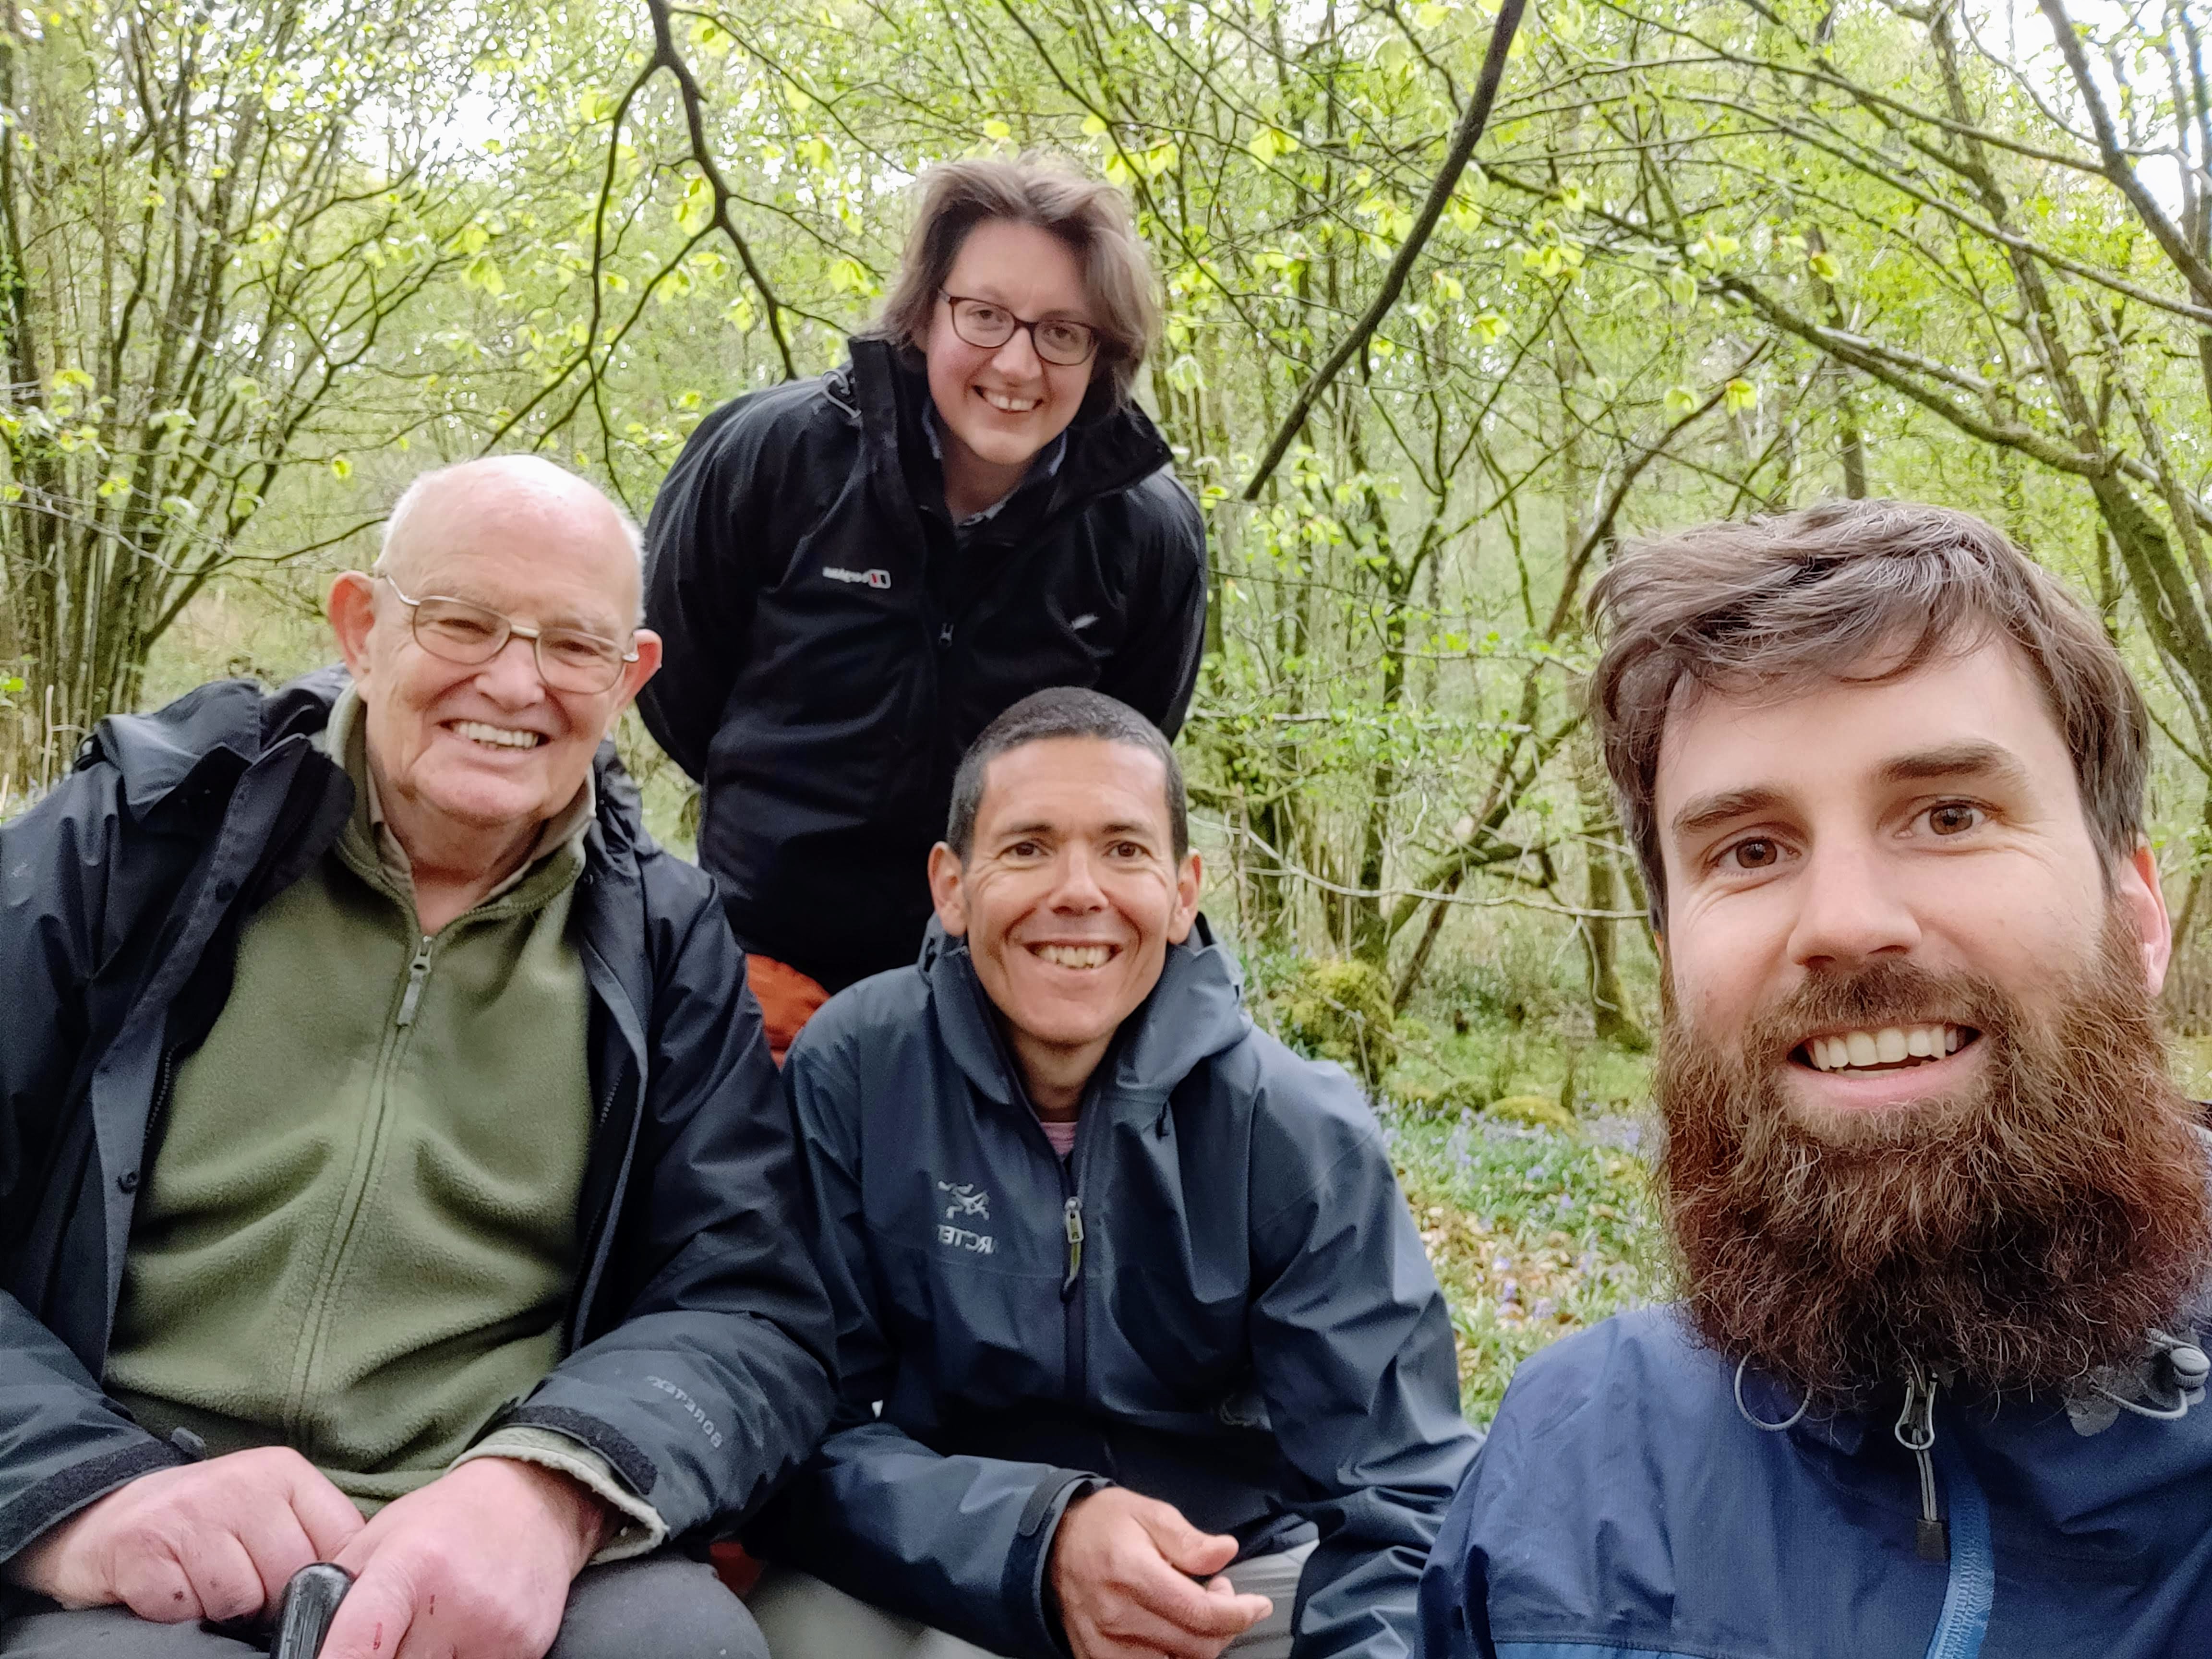
He was retired, but still affiliated with the Centre for Ecology and Hydrology in Cumbria where he had worked for much of his career and now lived. Claire Wood, a friend and former colleague of Bob’s, very kindly put us in touch with him. Safe to say Bob was both amused and bemused as to why his paper had lived on like this.
Amazingly, he was able to dig out the original data sheets he had written up in 1968, from a filing cabinet in his garden shed. This in itself is a lesson – how many of us will be able to find and retrieve the data for a specific graph in a few minutes, 50 years from now?
Bob also very generously took us to the original locations where he made his harvest measurements. It was immediately obvious how different these trees were from Wytham – well-spaced, managed as coppice with standards, quite narrow and relatively small for their age. And further again from open grown trees in Belgium, say.
Finding the answer
So why have Bob’s regression models been used so widely and possibly inappropriately?
First, harvest measurements are hard – expensive, tedious, time-consuming and of course, destructive. If you can avoid doing it, you will. And if you have to do it, you will do as few trees as necessary and probably more smaller ones than a few large ones to get a larger sample.
Second, allometric models encapsulate the assumption that mass scales with size in a predictable way. The long history of applying allometry to mammals, insects, birds, reptiles, flowering plants and so on has proved very fruitful, but with an equally broad range of possible theoretical explanations, constraints and exceptions.
Crucially, trees are rather different to most other organisms, being fixed in space and very slow-growing. This has led to some unique adaptations in terms of plasticity of form and, particularly, reproduction. Think about trees that can lower boughs to the ground and then re-sprout new trunks; trees that can sucker from roots or fallen trunks, coppice naturally or when cut, even when felled at the base.
All these things mean that it may be a bigger stretch to assume a stable size-mass relationship for trees, than for other organisms. Crucially, this stability is rarely tested, particularly for large, old trees for the reasons given above.
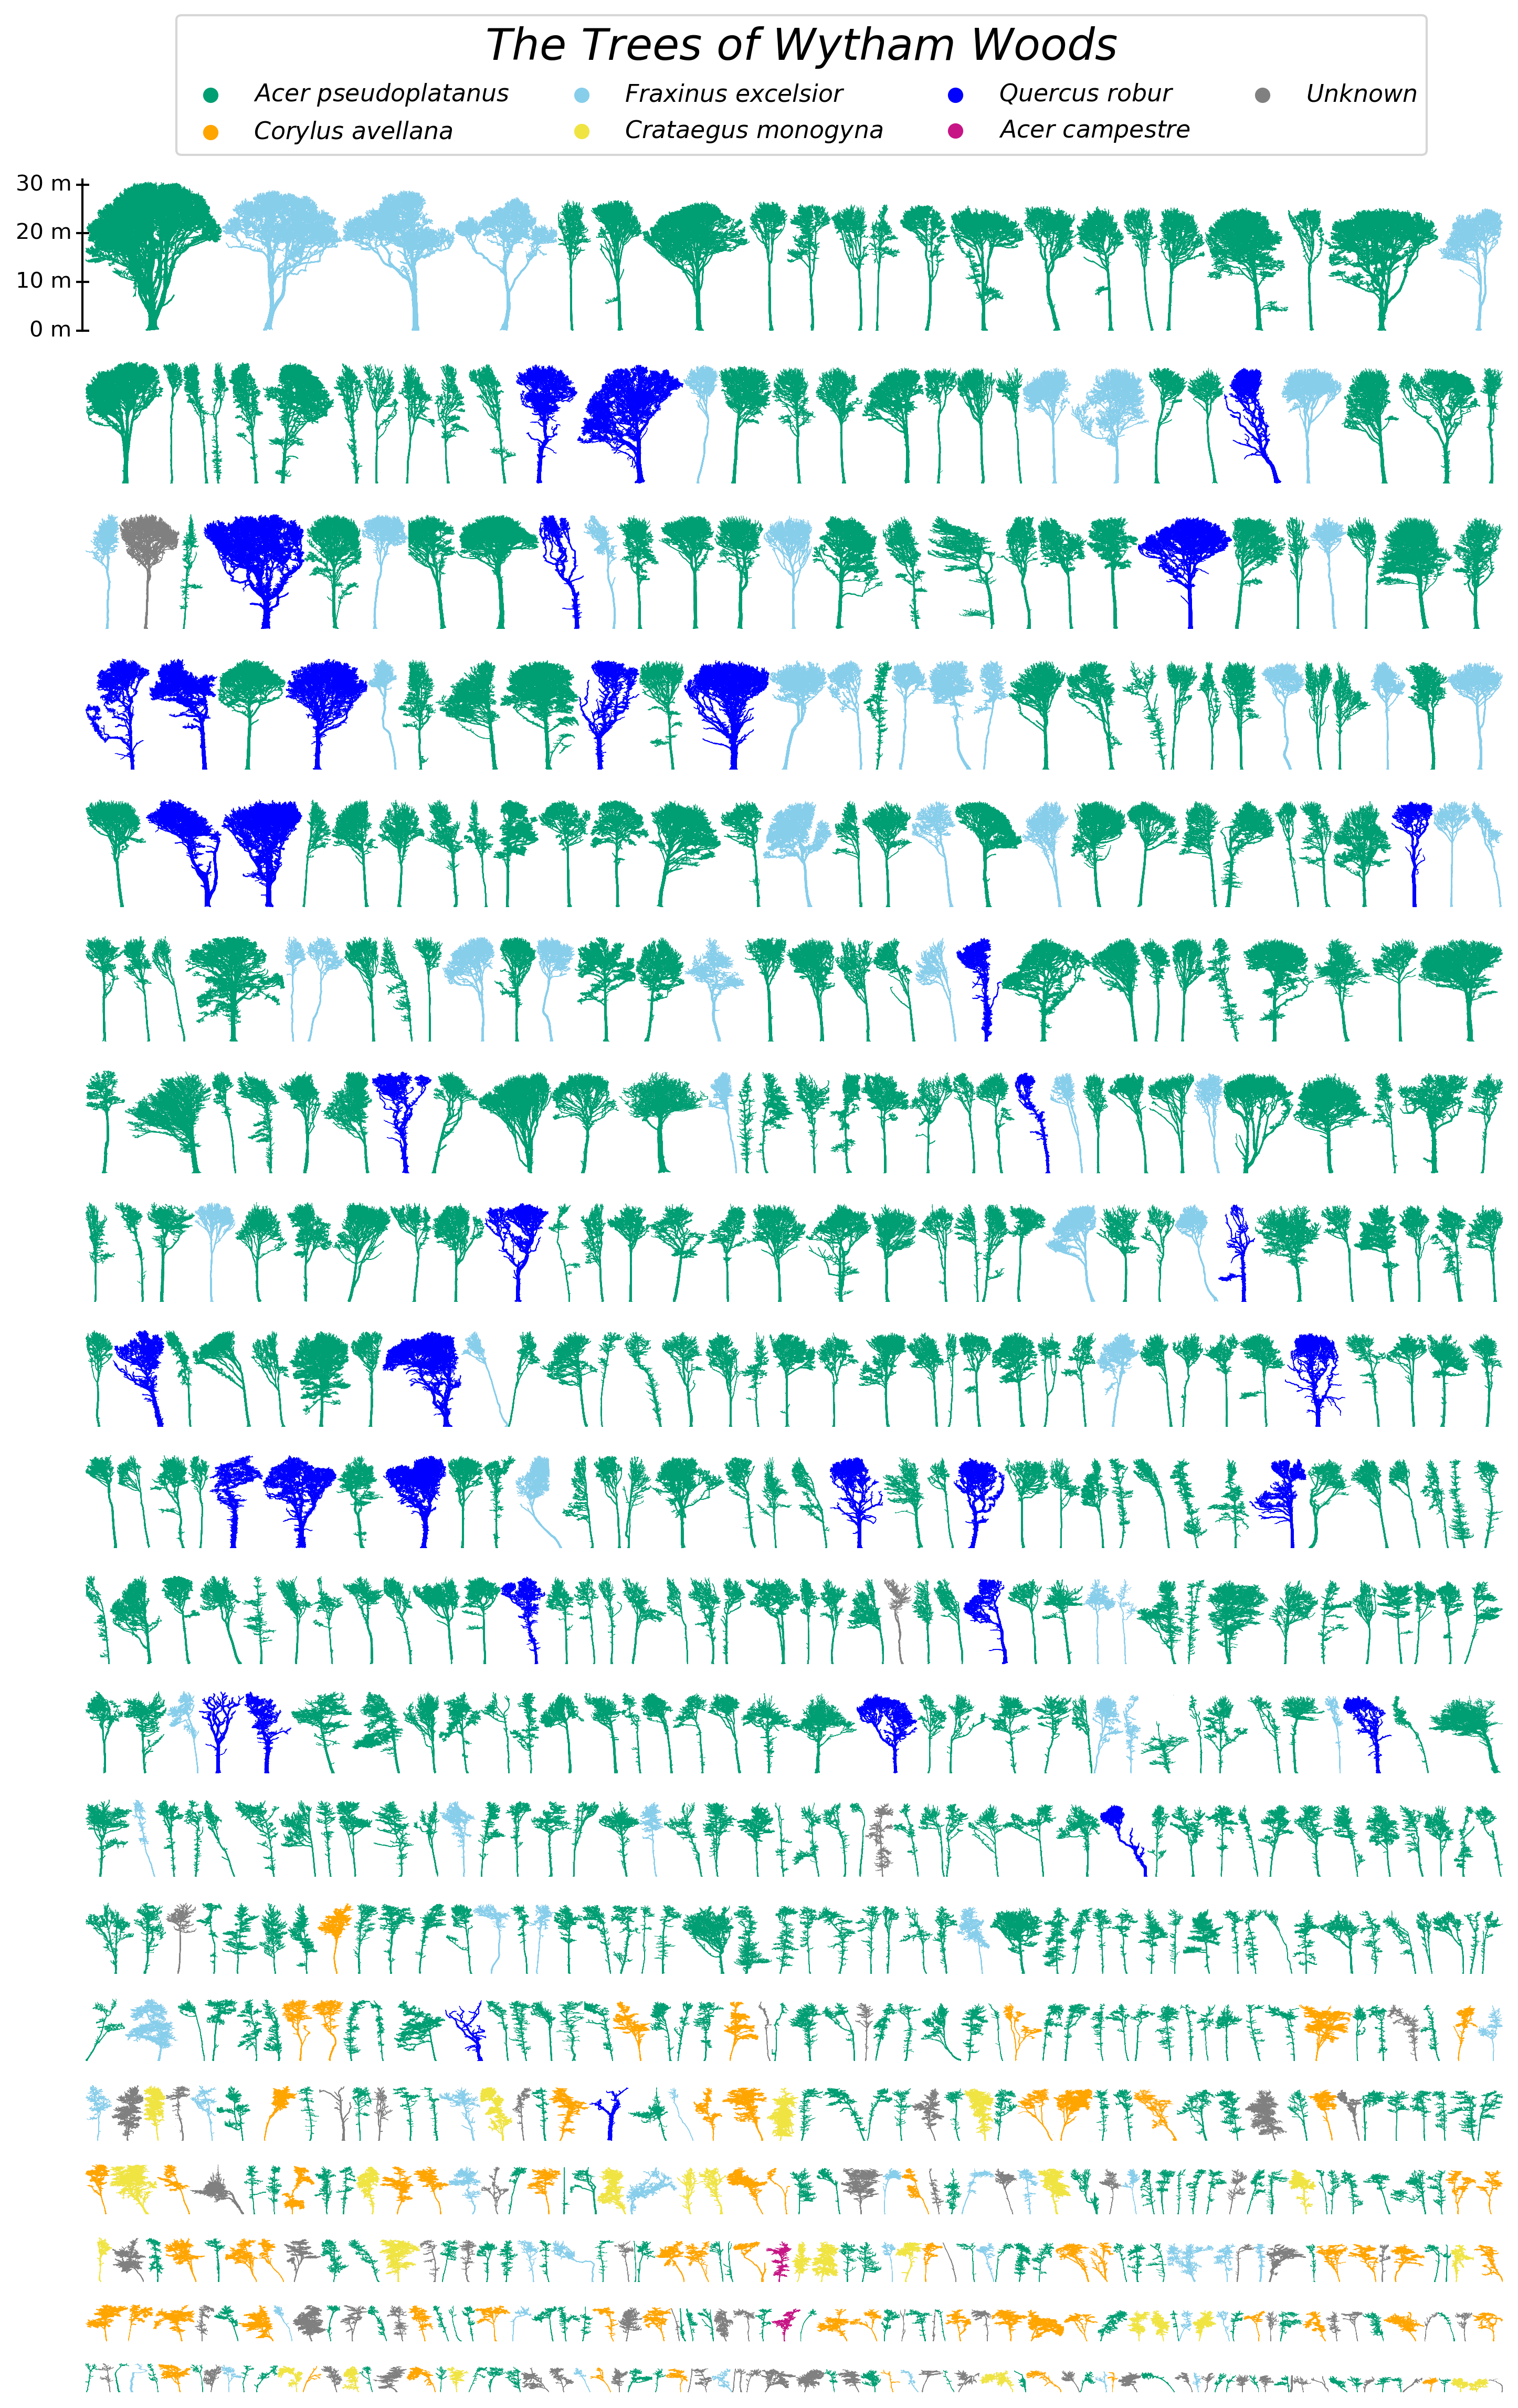
One major benefit of TLS is that it captures the 3D structure of all trees in a sample area, large and small. What we and others are finding is that large trees take on a wider range of shapes than smaller trees of the same species. The increasing variance of tree mass with size is well-known – Bob notes it in his original paper for example. So perhaps it shouldn’t be surprising that the very tight relationships that we see for small trees, where they are driven by the urgency of establishment, early growth and competition, are much less representative of the same trees when they are large.
This is exemplified in the gallery of tree forms we’ve scanned in Wytham, shown below:
So does allometry work too well? If these relationships were much weaker and more obviously variable (and the log-log space hides this of course), we might feel less certain in applying them so widely without local calibration, particularly for large trees.
Allometric models are powerful tools. We absolutely have to rely on them for large-scale estimates of biomass, from census measurements of DBH and for remote sensing estimates – we can’t estimate the biomass across the tropics without them! But there’s a real need to look more closely at the form of these relationships, for large trees particularly, since these trees store such a significant fraction of forest carbon and yet are the most uncertain. We may need to develop different models for different tree size classes for example. TLS won’t solve this problem, but it will provide new observations to help.
So yes, more research is needed. But given how important estimates of biomass are to our understanding of, and response to, climate change, this is crucial. And the experience we find from tracking Bob’s work back through multiple generations of studies is also very instructive: check your sources and your sources’ sources and all the way back to the original data if you can.
Dr Bob Bunce is a co-author of this paper. He sadly passed away earlier in 2022 and so didn’t get to see our paper get published. We only came across his meticulous 1968 work because it was so intertwined with the broader biomass story.
Others knew him and his work much better than we did. But we would like to thank him. Not just for his input to the paper, but more generally for the impetus it gave us, and hopefully others, to look again at this fascinating and important topic.
Read the full article: “Laser scanning reveals potential underestimation of biomass carbon in temperate forest” in issue 3:4 of Ecological Solutions and Evidence.