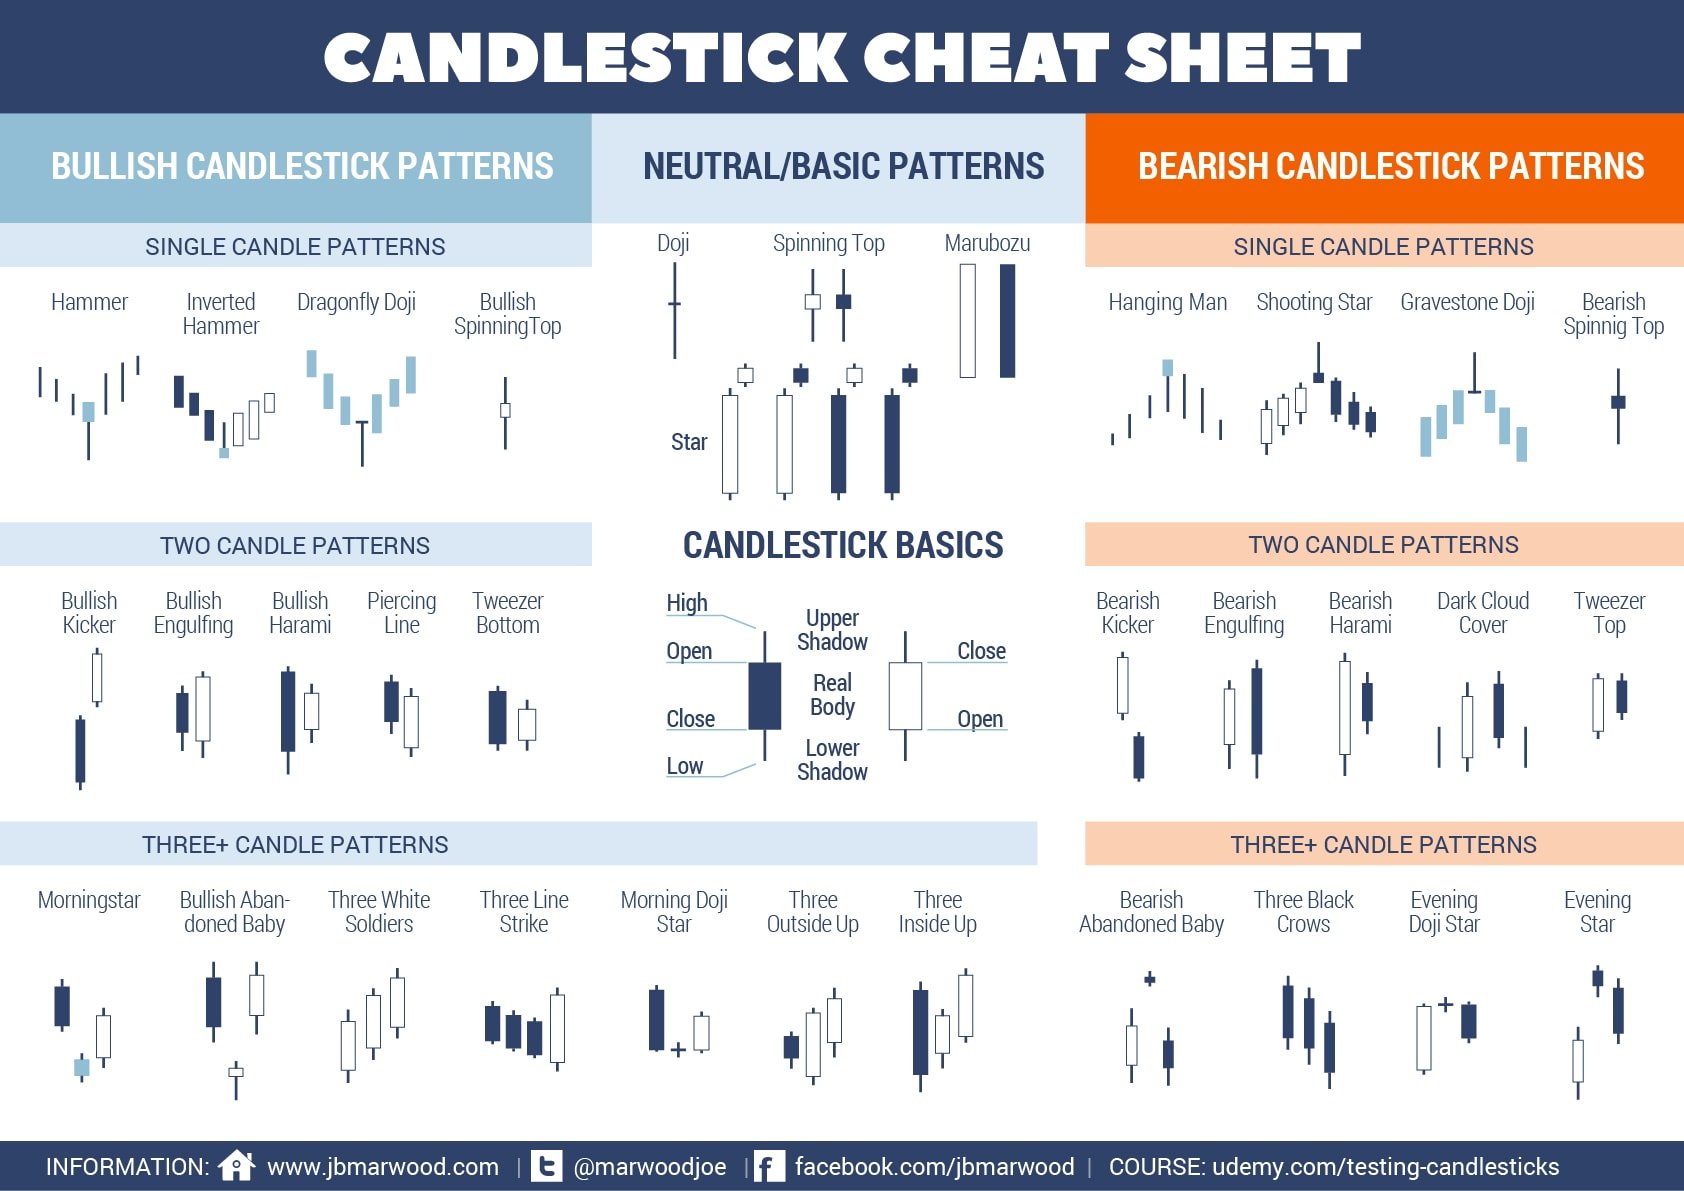
We’ve created this excellent candlestick pattern cheat sheet that will save you time and money. It’s perfect because you can download the candlestick cheat sheet pdf or print it and then use it to help recognize the different patterns during real-time trading. Yet, before you download the candlestick pattern cheat sheet, keep reading to learn everything you need to know about forex candlesticks.
Anyone who’s ever tried forex trading before knows that it’s difficult to quickly learn all the different methods and strategies you can use. Most people don’t realize that the easiest way to get into forex is by learning candlestick patterns. But while it may sound like an easy task, you should know that there are over 30 different candlestick patterns to memorize. And if you’re like some of us, trying to recognize them in real-time is a real headache – especially for beginners!
What Are Candlestick Patterns?
Traders commonly use several types of charts to help them find good trading opportunities. Such charts usually include:
- Candlestick charts
- Line charts
- Point and Figure charts
- OHLC charts
- Renko charts
As you can see, there are plenty of types of chart patterns you can learn for forex trading, but most traders agree that candlesticks are among the best. So, what are candlestick patterns? They are a form of charting analysis that forex traders use to gauge the market and locate good trading opportunities. The charts are based on historical price trends and data, and when used with other forms of fundamental and technical analysis, candlestick patterns offer forex traders valuable insight into possible trend breakouts, reversals, and continuation in the market.
Candlesticks originated in Japan during the 18th century and have been used in the western world as an effective method of analyzing financial markets for over one hundred years. Though they weren’t created to analyze foreign currency trading, they are primarily used for just that today. Traders prefer them because they are more visual than other more technical forms of analysis and give information on low, high, open, and close prices.
Candlestick Basics
Most prefer candlesticks for their simplicity and the ease with which you can analyze the market at a glance. Here’s a look at how candlesticks can help:
- They help to see highs and lows quickly.
- They help to identify if the candle was a Buy or Sell easily.
- Candlesticks help to identify strengths in the market easily.
- They provide different shapes and patterns that show a leading indicator of where the market might go up.
Candlestick Structure
In terms of structure, let’s take a look at the most essential points:
Close – This shows the point the session closed. When looking at a bullish candle, the close is located at the top of the body. Whereas, with a bearish candle, the close is located at the bottom.
Open – This shows the point the session opened. For a bullish candle, the open is located at the bottom of the body, where a bearish candle has an open at the top of the body.
Low – This shows where the market was at the lowest price during trading sessions. This information is used to show you how low the market moved within a single trading period.
High – This shows where the market was at the highest price during trading sessions. This information is used to show you how high the market moved within a single trading session.
How To Read Forex Candlestick Patterns
Understanding the structure we just discussed is just the beginning, so now that you know the basics, let’s discuss how to read forex candlestick patterns.
The candlestick body is used to indicate the difference between opening and closing prices for a single trading session. And you’ll notice that most candlesticks are colored because this makes it easier to see if it’s a bearish candlestick or bullish candlestick. The candlestick body is hollow, and the areas below and above the bodies are known as shadows.
Candlesticks are usually colored black or red, indicating that the opening price was higher than the closing price. If you see a candlestick that has a transparent body (may also be displayed using green or white), this means the opening price for the day was lower than the closing price.
Forex Candlestick Pattern Strategy
Forex candlestick reversal patterns are used to help traders identify continuations, breakouts, and reversals when you’re comparing currency pairs. The technical analysis identifies downtrends and uptrends within the forex market by drawing support lines on candlestick graphs. This information tells traders that it’s time to modify their stance by adding extra stop-losses or short selling to avoid losing capital.
Now that you know a little more about what forex candlestick patterns are, how to read them, and how they can help, let’s dive into the different segments of the candlestick pattern cheat sheet.
Bullish Candlestick Patterns
These candlestick patterns are formations that represent the presence of a buyer’s market. There are many different bullish candlestick patterns, and some are more popular than others. While we’re not going to discuss all of them today, some examples are:
- Dragonfly Doji
- Bullish Spinning Top
- Piercing Line
- Tweezer Bottom
- Three White Soldiers
- Three Line Strike
Hammer and Inverted Hammer
The hammer is a one-candle pattern that’s found at the end of a period of downward movement. This reversal pattern is bullish because it indicates that the observed instrument will soon take off in an upward trend thanks to the bulls in the market.
This is one of the easier forex candlestick patterns to recognize, as the hammer-like shape of the candlestick makes it obvious. The tail (that’s usually longer than the body) shows that bears are driving prices down on that specific trading day. If you see a hammer pattern, it shows that a great deal of buying pressure will follow the current low prices, and therefore, will reach a higher closing price.
Though the Hammer candlestick can be a good indicator, traders who solely set their positions on it often find themselves disappointed. So, when using this pattern, be sure to confirm it by observing the market for a few days after you notice it. This will ultimately validate if a bullish trend is forming or not.
Morning Star
Another popular bullish candlestick pattern is the Morning Star. It is constructed with three separate candlesticks, where the first one is a long red/black candle and followed by a Doji (short-bodied candle) before the pattern is then closed off with a long white/green candle.
The body color for the Doji candle can be either green/white or red/black, but the body does not touch the preceding candlestick. The Morning Star candlestick pattern is a favorite among traders, as it always gives them hope in a gloomy market.
The star indicates that the pressure to sell is slowing down, and the last candle in the pattern shows that traders are developing a renewed interest in buying. The appearance of this pattern usually marks the beginning of a bullish reversal trend.
Neutral/Basic Candlestick Patterns
When a candlestick pattern doesn’t show a change in the market direction, this is known as a continuation or neutral/basic candlestick pattern. The presence of these patterns usually signifies a period of market rest, as this occurs when the price movement is neutral or there’s indecision in the market. There are several types of neutral/basic candlestick patterns, such as Star and Marubozu. Here’s a closer look at two others, the Doji and the Spinning Top:
Doji
When an instrument’s opening and closing price is almost the same, you’ll notice a candlestick that looks like a plus sign or cross. One easy way to identify this pattern is by looking for a short or nonexistent body with wicks that vary in length.
The Doji pattern represents a struggle between sellers and buyers, resulting in zero net gains for both sides. Sometimes you’ll find the Doji alone, which is a neutral sign, but it can also appear in reversal patterns with the bearish Evening Star and bullish Morning Star.
Spinning Top
The forex candlestick pattern called Spinning Top features a short body that’s placed between wicks of an equal length. Experienced traders know that this pattern indicates market indecision which results in no significant price changes. Essentially, the bulls drove the price up, and then the bears drove it back down.
Many traders interpret Spinning Tops to mean it’s a good time for rest and consolidation. This pattern is usually benign when it appears by itself, but it can be taken as a sign of what’s to come since it signifies that market pressure is losing control.
Bearish Candlestick Patterns
And that finally brings us to bearish candlestick patterns, which tend to form after an upward trend and show resistance points. Intense pessimism about market prices often causes forex traders to close long-term positions so that they can take shorter positions and reap the benefits of falling prices. There are also many different bearish candlestick patterns that we won’t cover in detail today. Some of these include:
- Hanging Man
- Gravestone Doji
- Dark Cloud Cover
- Tweezer Top
- Three Black Crows
Evening Star
The evening star is a three-candle pattern that’s the bearish equivalent to the Morning Star. This pattern is formed when a short candle is positioned between a large red candle and a long green one. It shows that an uptrend is beginning to reverse and is especially strong when the third candle erases all of the first candle’s gains.
Shooting Star
The shooting star is best compared to the inverted hammer since they share the same shape, but the Shooting Star forms upward. You’ll recognize this candlestick pattern by the appearance of a small lower body and a long upper wick.
The Shooting Star usually sees the market gap a bit higher at the opening and then rally toward an intra-day high before closing just above open – much the same as a star falling to the Earth.
The Bottom Line
Regardless if you’re new to forex or have been trading for years, take advantage of our ultimate candlestick pattern cheat sheet. Download it directly from our site and never conduct trading without it!
Original infographic via decodingmarkets.com (formely jbmarwood.com) in 2016, content updated November 2021.