Hugo Sentenac discusses theirs and colleagues’ recent research article which uses data from a fungal pathogen and Darwin’s frogs to assess the magnitude of prevalence bias, as well as illustrate how it can impact disease risk assessment.
Infectious diseases: Batrachochytrium dendrobatidis
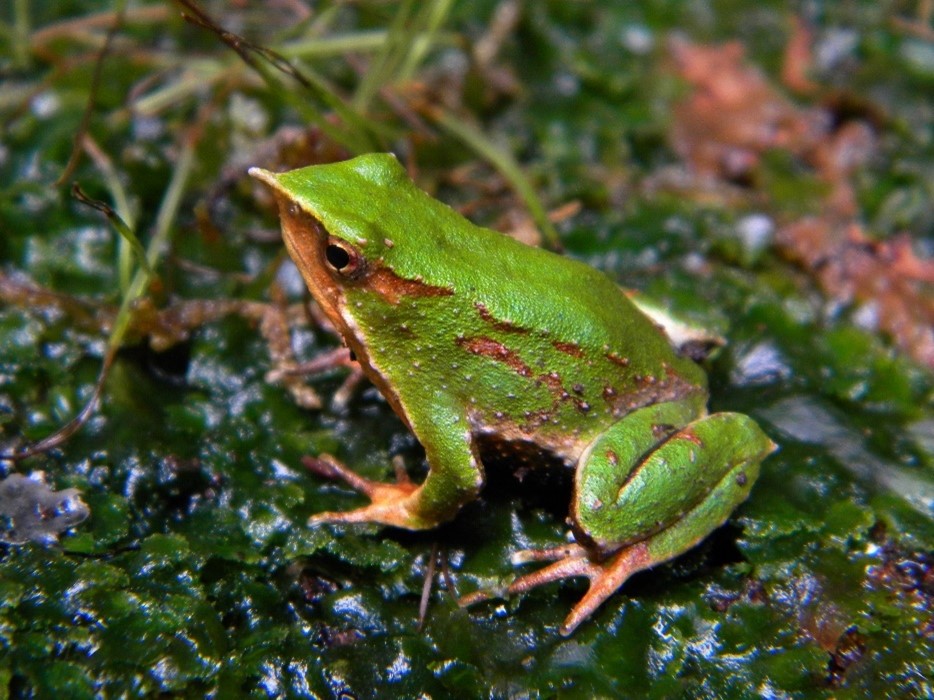
Certain infectious diseases have wrought havoc in nature. One dramatic example is the amphibian chytridiomycosis caused by the chytrid fungus Batrachochytrium dendrobatidis. It has led to the decline of many wild amphibian species, including the charismatic Southern Darwin’s frog (Rhinoderma darwinii), threatened with extinction in Chilean austral forests.

Accurate estimates of key infection parameters are essential for effective surveillance, investigation, and mitigation of infectious diseases. A frequently used parameter is the infection prevalence, i.e. the proportion of infected individuals. However, prevalence estimates can be biased for a number of reasons, especially when studying wildlife.
The challenges of studying wildlife diseases
Wild animals are difficult to find and catch. Prevalence is, therefore, often estimated during a period of time rather than at a specific point in time. As wild animals have no name or tag indicating their identity, some individuals may be sampled more than once by researchers or practitioners during this period. This is known as individual pseudoreplication, which can bias prevalence estimation.
Another problem is imperfect pathogen detection. False negatives (saying an individual is not infected when it is) are common when investigating wildlife diseases, just as they are in humans or domestic animals.
The difference is that, for the latter, we generally know how many false negatives the sampling process and the diagnostic test produce because there are reference tests. Unfortunately, the lack of means or reference tests often preclude test validation for the wild host-parasite system under study.
But we show here, using Darwin’s frogs and chytrid fungus infection, that there are ways to account for pseudoreplication and imperfect pathogen detection in wildlife.
Our study design
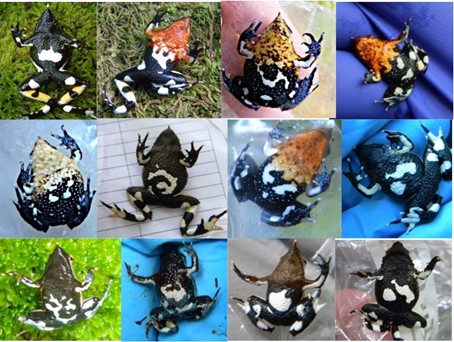
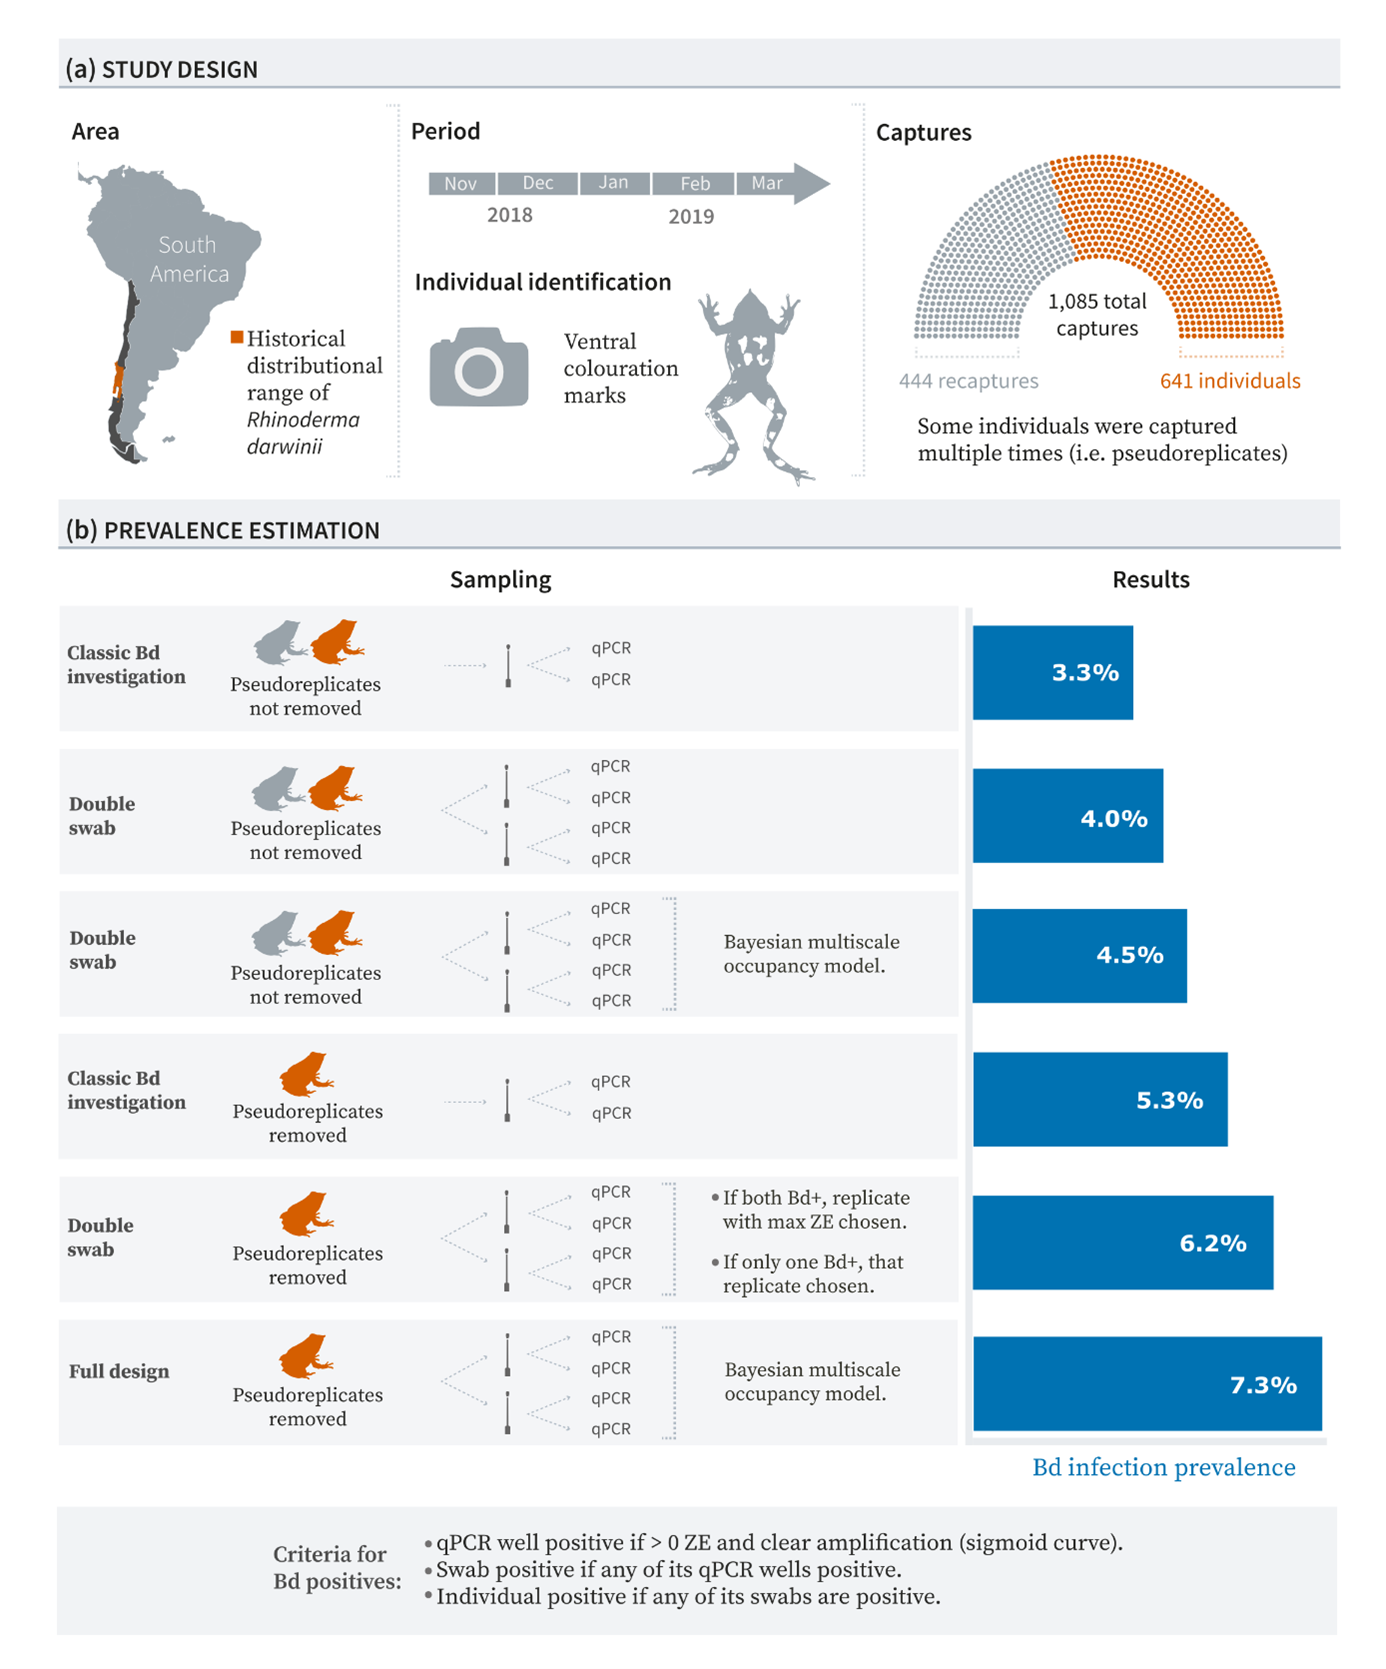
From November 2018 to March 2019, we made 1,085 captures of 641 R. darwinii individuals in Chile. Because each individual of this species has unique ventral patterns, we could identify individuals by analysing photos and thus evaluate the effect of pseudoreplication on prevalence estimation.
To tackle imperfect pathogen detection, we took two swabs per capture instead of just one. For each of the swabs taken, we performed not one but two diagnostic tests (qPCR) to detect the presence of pathogen DNA (indicative of infection). Replicating the swab and the diagnostic test allowed us to determine the probability of detection of Batrachochytrium dendrobatidis by both swabs and qPCRs.
In other words, we were able to get an idea of the false negative rate generated by our sampling process and diagnostic testing. With all of this, we were able to estimate a much less biased period prevalence.
Our findings
We found an observed (uncorrected) period prevalence of 3.3%. After removing host pseudoreplicates and accounting for imperfect sampling and diagnostic testing pathogen detection, we found an estimate of 7.3%.
Therefore, a classic Batrachochytrium dendrobatidis survey (one swab per individual, one qPCR per swab, and pseudoreplication not taken into account) would have underestimated the prevalence by a considerable 55%!
Why is this important for management decisions?
Prevalence is used for many purposes, for example to calibrate models used to predict the impact that a disease may have on a population. This is what we did for a fictitious population of Darwin’s frogs (fictitious, admittedly, but we still used fecundity and survival rates estimated by studying free-ranging populations of this species), whose fate we simulated over the next 20 years according to two scenarios:
- one with the observed prevalence estimate
- the other with the corrected estimate
In the first case, the predicted population decline was 10%, whereas it was 86% with our corrected estimate!
This simulation illustrates very well that failing to account for sources of uncertainty in epidemiological investigations can mislead us into underestimating the impacts of pathogen infection on wild populations. Only with robust epidemiological parameters can we effectively inform wildlife disease risk assessment and avoid wasting already scarce resources for management.
The methods used here can be applied to a wide range of host-parasite systems and will be of interest to both researchers and practitioners seeking to study and mitigate wildlife diseases.
Read the full article “Accounting for bias in prevalence estimation: The case of a globally emerging pathogen” in Journal of Applied Ecology
