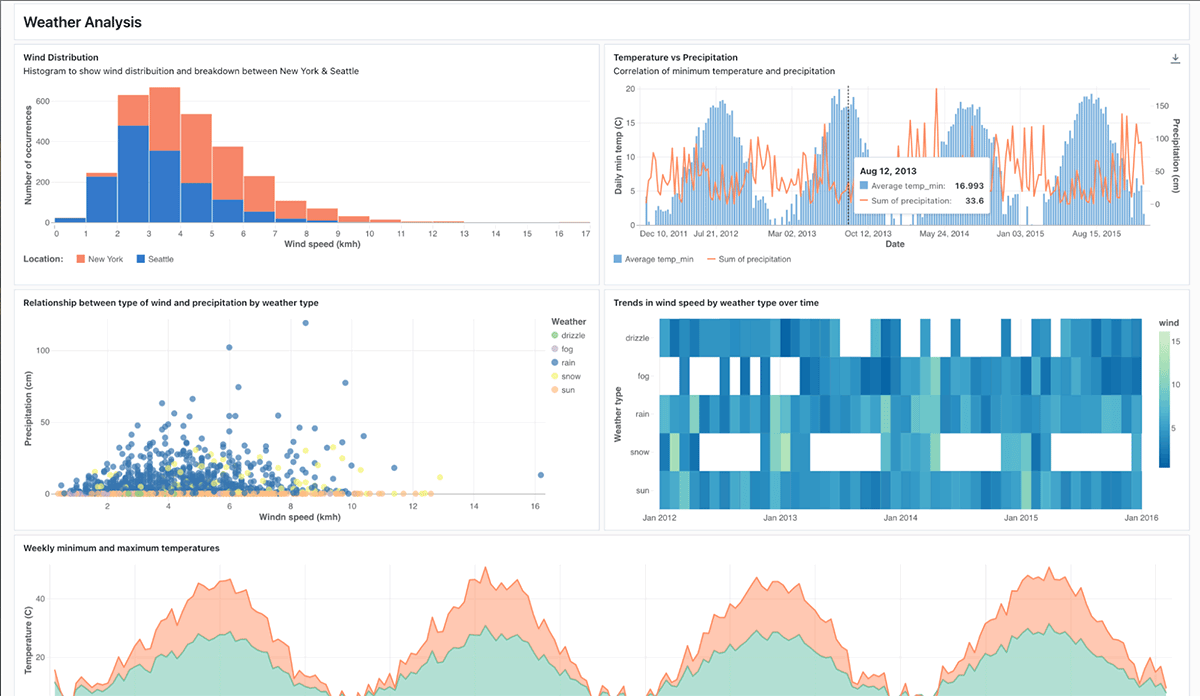
The next generation of Databricks SQL (DBSQL) dashboards, also known as Lakeview Dashboards, is now generally available on AWS and Azure. This new dashboarding experience is optimized for ease of use, scalable and secure distribution, governance, and performance.
“Lakeview dashboards have been critical to the latest product suite our team brought to market. We used Lakeview to quickly prototype new versions of our data centric products and actually show them to clients and prospects before investing in the development of the final version. Our product development cycle and as a result our sales cycle has been cut dramatically because of this ability.”
— Chase Cabanillas, Chief Technology Officer, Whip Media
In AWS and Azure, “DBSQL dashboards” have been relabeled to “Legacy dashboards” and “Lakeview dashboards” have been relabeled to just “Dashboards” as they’re now the default, generally available experience. GCP private preview is coming soon.
This new generation of dashboards for the Databricks Data Intelligence Platform includes the following capabilities:
- AI-assisted authoring: Databricks Assistant for Dashboards enables you to query data and generate visualizations through a conversational interface. Simply describe your desired state in natural language and let the Assistant generate SQL queries, explain complex code, automatically fix errors and paint a beautiful picture from your data.
- Simplified content model: Everything comprising the dashboard is consolidated into one file, making it much easier to share that dashboard to colleagues or move it to a new folder. This consolidation facilitates export/import between workspaces, including in Terraform scripts, and checking into your favorite version control system (e.g. Git).
- Speedy interactive analysis: Dashboards live side-by-side with your data. This enables a snappy initial load experience and near immediate response to filter change without having to wait for queries to rerun each time. Of course, with the power of Materialized Views, you benefit from data views that are pre-computed and automatically kept up-to-date as the sources change.
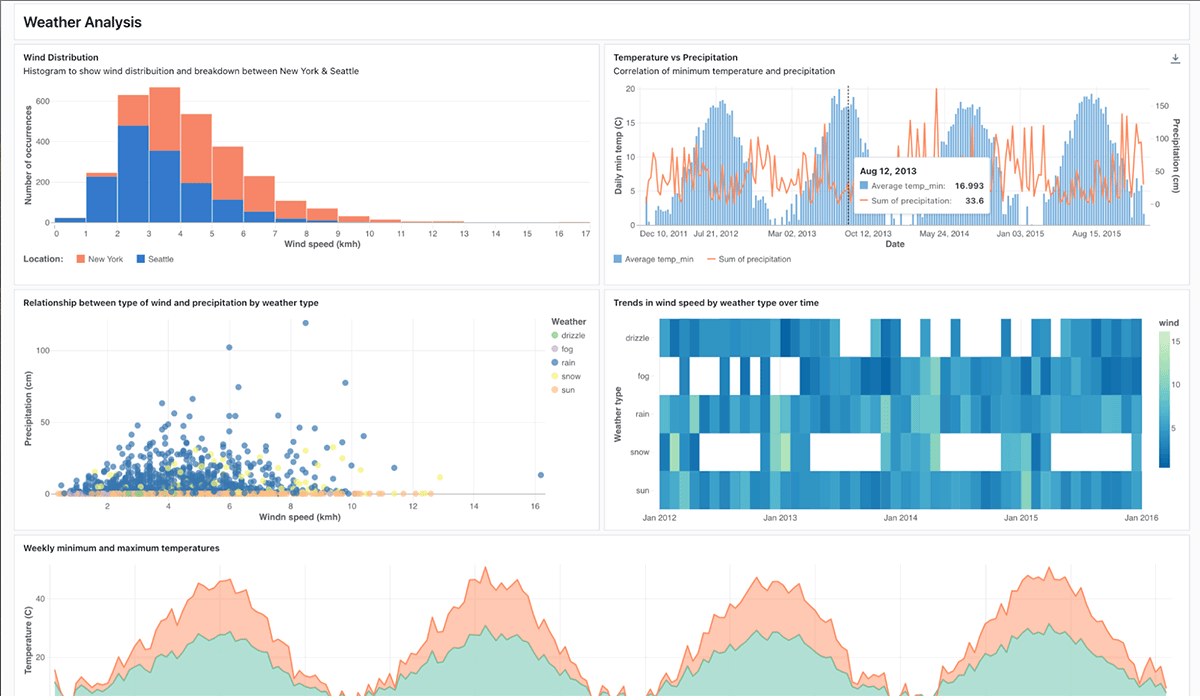
- Improved Visualizations: Dashboards showcase a sleek, modern and performant new visualization experience that delivers 10x faster chart rendering vs legacy, beautiful visualization styling, and new features such as improved color customization and sorted bar charts. Since public preview, we’ve added support for histograms, heatmaps, and combination charts, as well as customization for everything from axis ranges to field renaming.
- Scalable and secure distribution through the organization: Dashboards support draft/publish, periodic email of PDF snapshots, and securely sharing to business users and groups in the organization that just want to consume dashboards. No workspace access or viewer license required. Soon, we’ll also have support for embedding dashboards in your web apps and pages.
- Unification with the Data Intelligence Platform: Dashboards are governed by Unity Catalog with lineage built-in, so your consumers always know where the insights are coming from. Of course, because dashboards are available directly as part of the Databricks Data Intelligence Platform, there are no extracts to manage, no limits on data size and no separate BI servers to scale.

What’s ahead
General availability is just the beginning. There are very many more updates planned for dashboards in the coming months.
Expect the visualization layer to become even richer – with support for boxplots, maps, bubble charts, cross-filtering, color themes, and more. Keep an eye out for additional performance boosts, particularly with hundreds or thousands of concurrent users.
While both the legacy DBSQL dashboards and the new dashboards will co-exist for a period of time, we will eventually consolidate on the new dashboarding standard and we encourage you to leverage our migration helper to upgrade your legacy dashboards today.
In the meantime, join us for the Data Warehousing in the Age of AI Webinar, and enroll for Data Warehousing, Analytics, and BI sessions at Data + AI Summit.
We look forward to seeing what you build – onward and upward!


