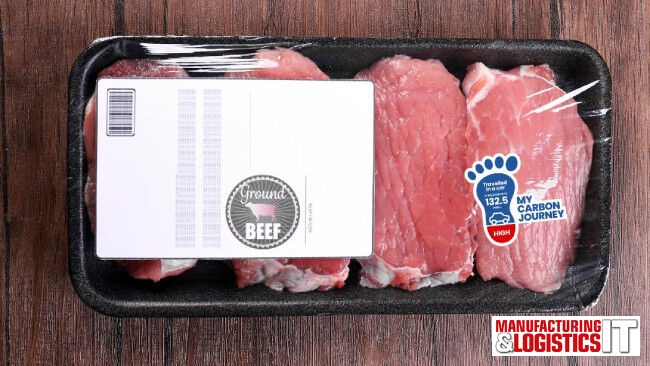
An AI image generator tool has predicted what the future of food labelling might look like for consumers and manufacturers.
This follows news that the appetite towards a more-carbon-friendly future appears to be turning amongst UK consumers after a recent YouGov survey found more than half of all young adults think they would eat a more carbon-friendly diet should carbon footprint labelling be introduced in the UK.
The research, carried out by food regulatory consultants Ashbury, took 30 popular food items found in the average household and used the BBC’s Climate Change Food Calculator to establish the amount of CO2 per kg emitted for a portion of food. They then used this information to work out the emissions per standard quantity of food in a typical package size.
Labelling has often had to fight its corner with brands continuing to face challenges in finding a model that works. The traffic light labelling system is just one of those, with the voluntary scheme introduced by the government in 2007. This research follows a soaring demand for consumers to have even clearer information about how their food got to their table and the impact its journey has had on the environment.
Ashbury used these figures to calculate an equivalent figure to enable a real life comparison to be made, such as; the number of miles travelled in a petrol car, the number of days heating an average UK home, litres of water used / number of showers lasting 8 minutes and the equivalent in square metres of land used.
Ashbury used AI image generator Midjourney to then generate what these labels might look like in the future, were this method to be adopted by retailers.
Food item: Coffee
Quantity: 300g
Greenhouse gas emissions: 15.34kg
Food item: Tea
Quantity: 200 Tea Bags
Greenhouse gas emissions: 8.21kg
Food item: Beef
Quantity: 500g
Greenhouse gas emissions: 51.53kg
Equal to: 131.43 miles driven in a petrol car
Food item: Lamb
Quantity: 500g
Greenhouse gas emissions: 28.87kg
Equal to: 73.74 miles driven in a petrol car
Food item: Prawns
Quantity: 150
Greenhouse gas emissions: 8.6kg
Equal to: Heating the average UK home for 1.36 days
Food item: Rice (uncooked)
Quantity: 1kg
Greenhouse gas emissions: 9.9kg
Equal to: Heating the average UK home for 1.56 days
Food item: Chocolate (Dark)
Quantity: 200g
Greenhouse gas emissions: 4.23kg
Equal to: Using 71 litres of water and having one shower lasting 8 minutes
Food item: Chocolate (Milk)
Quantity: 200g
Greenhouse gas emissions: 2.94kg
Equal to: Using 207 litres of water and having three showers lasting 8 minutes
Food item: Cheese
Quantity: 400g
Greenhouse gas emissions: 12.80kg
Equal to: Using 47.3m2 of land
Food item: Milk
Quantity: 2.272 ltr
Greenhouse gas emissions: 7.13kg
Equal to: Using 20.29m2 of land
Jade Collins, technical controller at Ashbury, commented on the findings:
“So much is already being done by manufacturers and retailers to keep consumers informed on what is going into their food. For example, the traffic light system which came in over a decade ago has been able to provide some further clarity to consumers to identify whether a product is considered healthy or not.
“But it’s interesting to see consumers now going that step further and keen to get even more information on how their food was manufactured and produced but crucially the impact that the process has had on the environment.
“The ball is now in the court of the manufacturers and producers to answer consumers’ challenge to provide more information about the impact of their foods. This research gives us an indication as to what this future might look like.
“It’s easier said than done, as there are some major challenges in collecting and analysing data in this space to create a consistent and transparent approach – which is key to supporting consumer understanding.“
Daniel Usifoh, co-founder at sustainability software provider Axiom also outlines the challenges for manufacturers in providing accurate carbon footprint measurement but also the opportunities it presents when doing it right, explaining:
“For food manufacturers, gathering accurate data on Scope 1 and 2 emissions like energy, process steam and fuel use is reasonably straightforward. Scope 3 – supply chain emissions – is where the big challenge lies.
“Many manufacturers simply don’t have enough information on where their ingredients come from – let alone how they are grown or produced! Filling these data gaps is the only way to get an accurate carbon footprint measurement – and this starts with effectively mapping the supply chain.
“Once companies have an accurate picture of where all their ingredients come from, they can start engaging with suppliers to gather data. Right now, measuring the true footprint of some commodities is virtually impossible – there simply isn’t the traceability in the global supply chain. However, companies can use industry averages to provide a reasonable estimate, and start to build up a picture of the total carbon footprint from there and solutions like these designs can help consumers to gain a more tangible picture of how their purchasing decisions have an impact.
“In theory, carbon labelling is a great idea with real potential to influence behaviour – it’s something we need to work towards this decade. However, the labelling needs to be based on accurate data and standardised methodologies if consumers are going to trust the label. If the industry is using multiple different schemes or labels, the whole idea loses its credibility.
“We’re already seeing how keen some companies are to display their environmental credentials – and we expect that to grow over the coming years in the food and drink industry.”
Methodology
We took 30 popular food items found in the average household and used the BBC’s Climate Change Food Calculator to establish the amount of CO2 per kg emitted for a portion of food. We then used this information to work out the emissions per standard quantity of food.
The recommended serving size of which the BBC data was based, were from the British Dietetic Association (BDA) and healthy diet portion sizes from BUPA. The methodology does stipulate that these portion sizes are often lower than would be reasonably consumed, therefore, we converted the calculations to reflect standard pack sizes found in supermarkets.
We also used the resulting calculations to establish what these emissions would look like in other forms, based again on the figures from the BBC’s calculator; number of miles travelled in a petrol car, number of days heating an average UK home, and litres of water used / number of showers lasting 8 minutes.
Data may vary depending on sources used.
The prompts for each of these images generated using AI image generation software: Midjourney
Data correct as of August 2023


