NuGraph is a graph database platform developed at eBay that is cloud-native, scalable and performant. It is built upon the open-source graph database JanusGraph, with FoundationDB as the backend that stores graph elements and indexes. This article presents GraphLoad, a utility developed at eBay to load and update graphs at scale. GraphLoad is deployed in production to load a graph that has grown to over 10 billion vertices, loading both real-time streaming data and as batch data from files, while continuously serving real-time graph queries.
GraphLoad provides a generic solution to load different source data layouts and graph schemas. Based on the distributed transaction support from NuGraph, it provides exactly-once loading and updating guarantees under various failure conditions. GraphLoad performs parallel loading with hundreds of loaders located in multiple data centers, with scalability and high availability supported by NuGraph.
Motivation and Challenges
Many applications at eBay, including eBay customer-facing applications, internal business operations and IT management operations, require Graph Databases (GraphDBs) to capture and make use of business insights derived from diverse data sources. In a GraphDB, business insights are stored as a graph, with vertices representing business entities and edges representing the relationships between the business entities. Business insights are continuously loaded and updated in order to assist real-time decision making.
A number of difficulties make developing a scalable graph loader non-trivial and time consuming, especially when the graph reaches a size in the order of tens of billions of vertices:
- Data consistency guarantee: How do we guarantee data consistency from parallel loaders that may simultaneously create and update vertices and edges?
- Exactly once guarantee: How do we guarantee no data loss and duplication even when graph data loading experiences various kinds of failures? Such failures can happen to any components in the end-to-end system, from the loader all the way to the backend database.
- Loading with flexible graph schemas: How do we handle loading of arbitrary graph schemas, so that the same graph loader can be used in different application domains? How do we load in a way that is idempotent?
- Graph data validation: How can we validate that the data is correctly loaded to ensure data quality?
GraphLoader Overview
Figure 1 shows the overall architecture of GraphLoad. It includes a real-time loader with parallel instances to load data from the Kafka stream, and a batch loader with parallel instances to load data from the files located in the Distributed File System (our current implementation uses OpenStack Ceph, which exposes POSIX file system APIs). Both real-time and batch loader instances employ the NuGraph Client Library to issue remote graph traversals that execute graph loading and graph updating to the NuGraph keyspace.
Figure 1: The overall architecture of GraphLoad. The real-time stream loaders load streaming data from Kafka streams. The batch file-based loaders load files from the Distributed File System mounted as a persistent volume.
In the batch loading path, HDFS holds the data produced by external data sources. The Data Transfer Service imports data generated in our Hadoop cluster into the Distributed File System. Each loader instance (File Loader) requests a file assignment from the Loader Manager and performs graph loading based on the data stored in the file. Once a loader instance finishes the loading, it will update its status to the Loader Manager and request a new file to continue data loading. The Loader Manager is equipped with a local database to manage the loading state of the files produced at the Distributed File System, so that if a file does not get loaded by one loader instance successfully, it will be re-assigned to a different loader for loading.
In the stream loading path, each loader instance retrieves Kafka messages from the subscribed Kafka streams. The messages are produced by external data sources. The stream loader adopts the Kafka consumer policy of “auto offset reset = latest” [1] to record the state of message consumption. Should a loader instance fail, a different instance will pick up the message processing from the committed state. Thus, the Kafka broker serves as the loader manager for stream loading.
The real-time stream loader instances handle the stream data continuously. The batch loader instances process the files as they are delivered by the Data Transfer Service upon the completion of daily jobs. The number of the instances can be in the order of hundreds (in our deployment, 200 loader instances) to handle a large number of files. To improve scalability, the batch loader instances can be deployed into multiple data centers, in order to take advantage of the multi-data center deployment of NuGraph.
The Scalable and Highly Available Cross-data Center Deployment of NuGraph
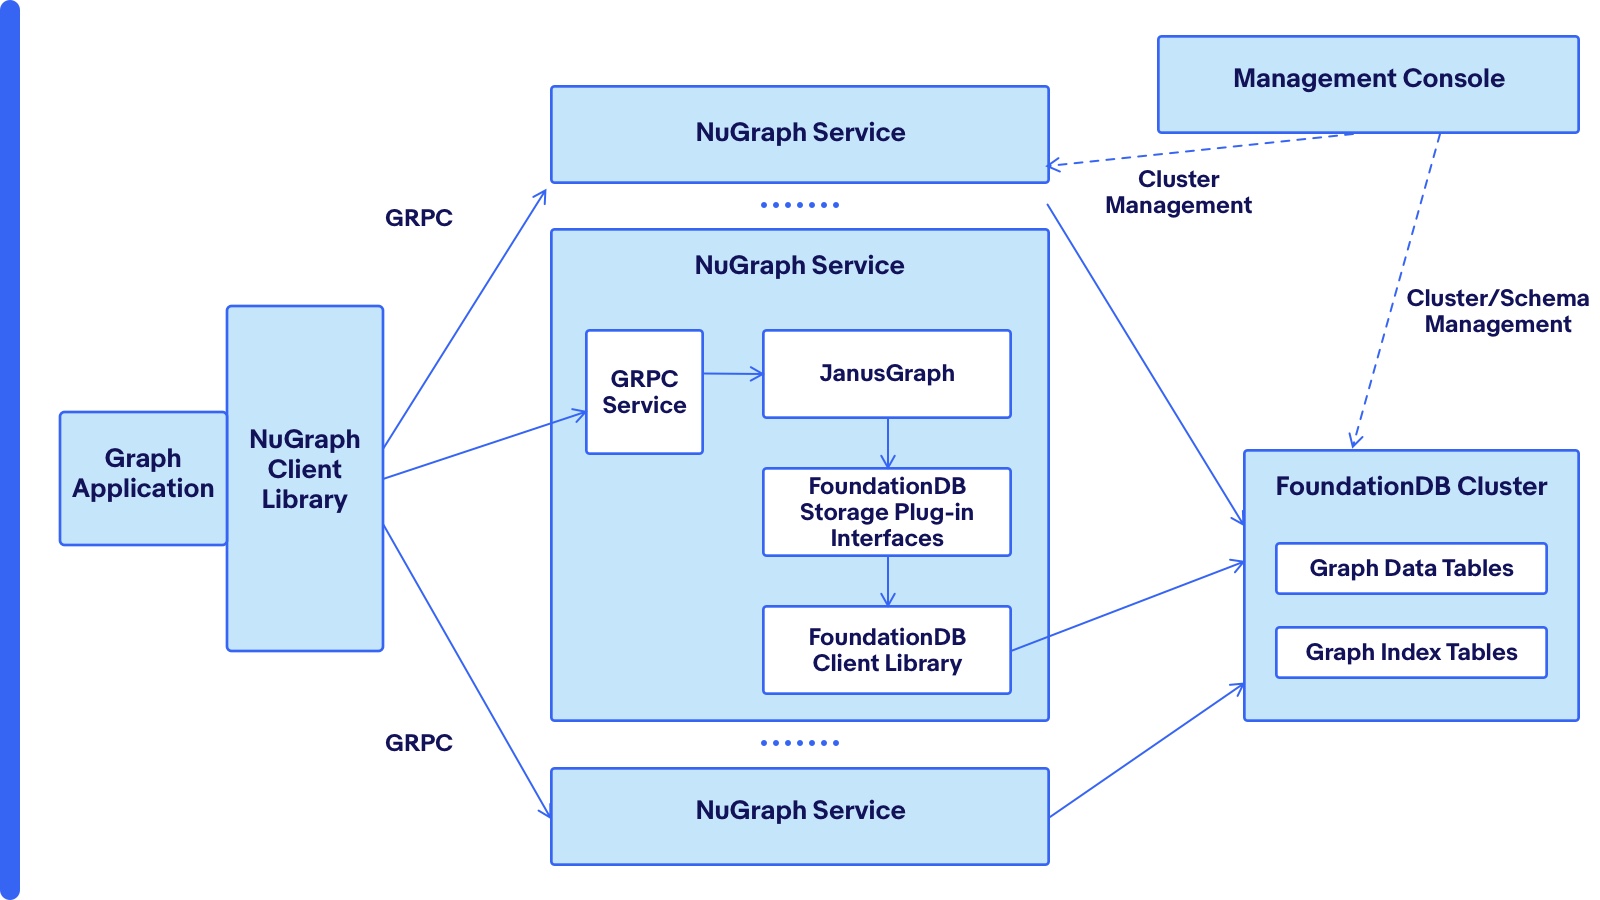
NuGraph follows a three-tier architecture, as shown in Figure 2. The graph application employs the NuGraph Client Library to issue the Gremlin-based graph queries (expressed as graph traversals) to create and update graph elements (vertices, edges and properties associated with vertices and edges). Each query request comes to a service node in the NuGraph Service tier via the GRPC protocol. In the NuGraph service node, the request is processed by JanusGraph and its FoundationDB storage plugin. It is at the storage plugin that the graph traversals get translated to the FoundationDB key/value based operations (for example, set, get and getRange). The FoundationDB cluster stores both graph elements and indices.
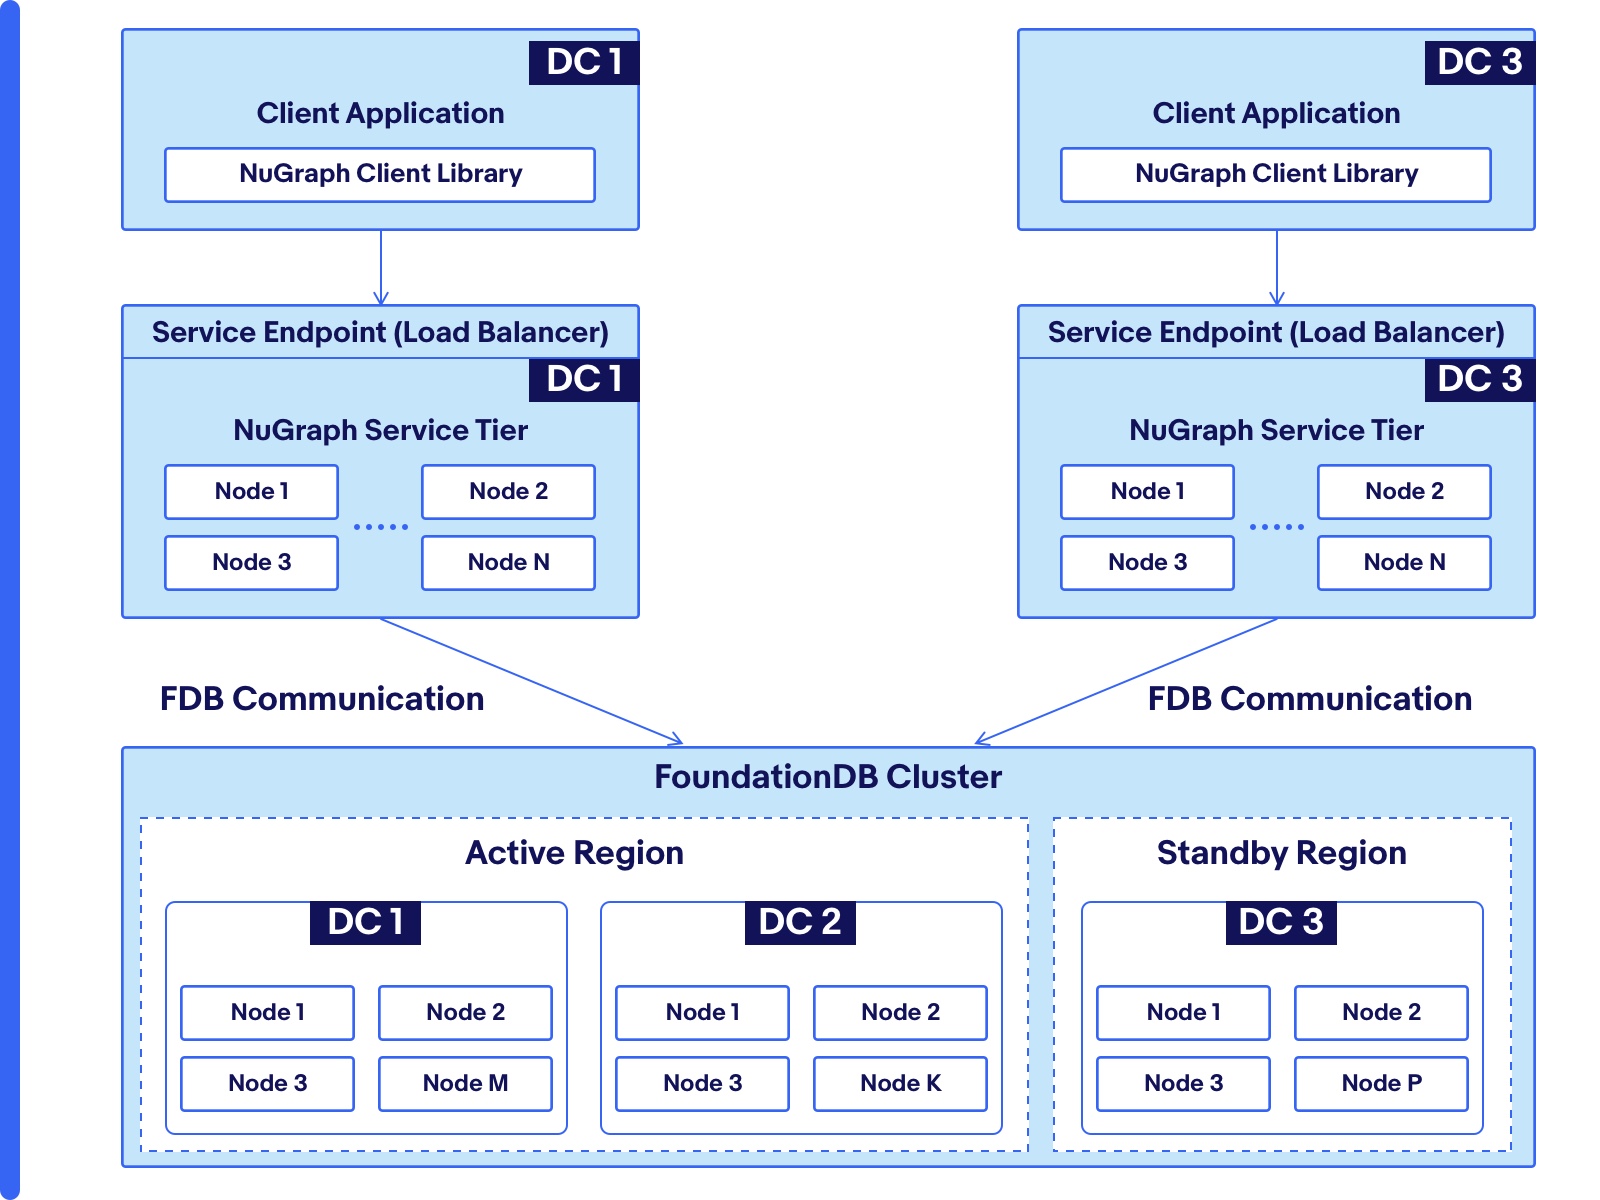
Figure 3 shows the entire NuGraph deployment across three data centers, which are labeled as DC 1, DC 2 and DC 3. The Client Application is deployed in DC 1 and DC 3. The NuGraph service tier is deployed in DC 1 and DC 3, with a load balancer in each data center to distribute requests to the deployed service nodes. GraphLoad is a client application to NuGraph.
Figure 2: The NuGraph three-tier architecture.
Our FoundationDB deployment [2, 3] is across three data centers following the asymmetric configuration model [4]. Each of DC 1 and DC 3 hosts three data copies. DC 2 serves as the transaction log store for high availability, and does not hold actual data copies. We choose not to deploy the NuGraph service tier at DC 2, because each read (query) from a service node at DC 2 to the FoundationDB backend database will always have to be routed to the FoundationDB storage nodes in DC 1 or DC 3, and thus will introduce cross-data center latency.
Under normal operation, the FoundationDB nodes in DC 1 and DC 2 form an active (primary) region and the nodes in DC 3 form the standby region. Both regions can serve reads and writes, although writes to DC 3 have to be always routed to DC 1, because only the primary region can handle the writes. The reads can be handled by both regions. FoundationDB can be forced to operate in a single-data center mode, if either one of the three data centers is down. For example, if DC 1 (DC 3) is down, DC 3 (DC 1) forms the operational region. When DC 2 is down, because DC 2 is affiliated with DC 1, DC 3 will become the single operational region.
For GraphLoad, under the normal operation situation, data loading can come from both DC 1 and DC 2 for better scalability. When the whole data center, either DC 1 or DC 3, goes down, loading traffic can still happen to the other data center, even though loading and read latencies will go up, because the entire system now operates at half of the normal capacity. Though data center being down happens rarely in our real-production environment, we have planned data center maintenance such as OS security patching. During some major maintenance, to reduce the disruption to the cluster, the cluster is manually triggered to operate in a single data center mode.
Figure 3: The multi-data center deployment of a NuGraph keyspace.
GraphDB Transaction Guarantee for Exactly-Once Data Loading
In JanusGraph [5], graph elements are vertices and edges. Each vertex or edge can have a label and multiple properties. Vertices are connected by edges to represent the relationships between them. Each graph traversal is executed as a transaction. FoundationDB as the storage backend for JanusGraph provides distributed transactions that ensure the ACID properties (atomicity, consistency, isolation, and durability). Once a transaction commits (i.e., a graph traversal executed successfully), all changes are persisted; otherwise, none is applied (no partial update is persisted). Distributed transactions provide the base to our solution to construct graph traversals that produce exactly-once guarantees for both inserts and updates. In addition, we leverage the following two features specific to graph processing:
- Unique key look-up. Each vertex is defined with a unique key, which may be a combination of property keys. Both updates of the vertex and the corresponding indexes are executed in a single transaction. This unique key is indexed as a JanusGraph composite index [5]. As a result, a vertex can be uniquely looked up with this key.
- Batch transaction [2, 3]. A transaction can involve multiple updates related to multiple vertices, edges and properties. By having multiple updates batched in a single transaction, graph loading performance can be improved significantly.
1    g.V().hasLabel('employee').has('employeeId', 101).fold()
2         .coalesce(__.unfold(), __.addV('employee').property('employeeId', 101))
3         .property('age', 27).property('company', 'eBay').next()
Figure 4. A graph query example to insert a vertex and its property values, in one single transaction.
Figure 4 shows an example of a graph traversal to insert a vertex if it does not exist, and then insert/update (upsert) the property values of this vertex. In this example, “employeeId” is the unique key and it can be used to look-up the vertex via the has() function. Line 1 checks whether an employee with id 101 exists. If it does not exist, Line 2 inserts a new vertex for the employee with employeeId=101. Line 3 updates properties “age” and “company” of this vertex (either newly created or exists before) with new values. The entire graph traversal as one single transaction is equivalent to the pseudo-code in Figure 5.
1    transaction start
2    v := getVertex(label=employee, employeeId=101)
3    if v does not exist:
4        v := createVertex(label=employee, employeeId=101)
5    endif
6    v.updateProperty(age=27)
7    v.updateProperty(company=’eBay’)
8    transaction commit
Figure 5. The pseudo-code of graph traversal in Figure 4.
1    g.V().has("employeeId", 101).as("src")
2        .V().has("employeeId", 102)
3        .coalesce(__.inE("knows").where(__.outV().as("v")),
               __.addE("knows").from("src"))
4        .property("year", 5).next()
Figure 6. A graph query example to insert an edge between two vertices if it does not exist, and then to insert/update its property values, in one single transaction.
We could construct a similar graph traversal for upserting an edge, as shown in Figure 6. Line 1 and 2 retrieve the source and destination vertices given their unique values on property “employeeId”. Line 3 checks whether there is an edge labeled “knows” between them. If not, it creates one. Line 4 upserts the edge property key “year” to have value 5. Figure 7 is the equivalent pseudo-code of this graph traversal.
1    transaction start
2    v:= getVertex(employeeId=101)
3    v2 := getVertex(employeeId=102)
4    e := get edge from v to v2 with label "knows"
5    if e does not exist:
6        e := create edge from v to v2 with label "knows"
7    end if
8    e.updateProperty(year=5)
9    transaction commit
Figure 7. The pseudo-code of the graph traversal in Figure 6.
Constructing graph traversals that follow the data loading patterns proposed in Figure 5 and Figure 7 is particularly useful to create and update a bulk of vertices and edges. Figure 8 provides an example for such long graph traversal with three vertices and two edges:
1    g.V().hasLabel('employee').has('employeeId', 101).fold()
2        .coalesce(__.unfold(), __.addV().hasLabel('employee').property('employeeId', 101))
3        .property('age', 27).property('company', 'eBay').as('v1')
4    .V().hasLabel('employee').has('employeeId', 102).fold()
5        .coalesce(__.unfold(), __.addV().hasLabel('employee').property('employeeId', 102))
6        .property('age', 31).property('company', 'Amazon').as('v2')
7   .V().hasLabel('employee').has('employeeId', 103).fold()
8        .coalesce(__.unfold(), __.addV().hasLabel('employee').property('employeeId', 103))
9        .property('age', 28).property('company', 'Microsoft').as('v3')
10   .select('v2').coalesce(__.inE('knows').where(__outV().as('v1')),
__.addE('knows').from('v1')).property('years', 7).
11   .select('v3').coalesce(__.inE('knows').where(__outV().as('v1')),
__.addE('knows').from('v1')).property('years', 2)
12   .next()
Figure 8. A graph traversal that loads a subgraph with three vertices and two edges.
The proposed data loading patterns can handle various failures that can happen to the NuGraph service tier and also the FoundationDB tier, and the communication channels between graph loaders and service nodes, and between service nodes and FoundationDB nodes. There are three particular failures that can happen to FoundationDB that deserve special attention.
The first one is due to parallel loading. Different loaders may try to update the same vertex or edge concurrently, which can lead to transaction conflicts raised from FoundationDB. To address transaction conflicts, the graph loader may adopt a retry algorithm with exponential backoff. The second one is due to transaction-with-unknown-result, indicating that the transaction may or may not have been committed. This can happen due to transient failures to the internal DB engine. Because inserting a vertex or edge and creating the corresponding composite key index is in the same transaction, the retry of any query following the patterns proposed in Figure 5 and Figure 7 guarantees that no insertion duplication happens in multiple retries. The third one is about transaction time exceeding the five-second limit imposed by FoundationDB, which results in the transaction-too-old exception. The way to address this failure is to have the graph loader to back off on the number of vertices and edges that need to be inserted in each batch of transaction.
Graph loaders can crash and restart. In order to guarantee graph loaders to insert or update vertices or edges with exactly-once guarantee, we construct queries to be idempotent (add if does not exist). Loaders can re-process the same data over and over, without creating redundant graph elements. Upon a loader failure we either reload from the start of the file, or, for efficiency, from the checkpoint last reported to the Load Manager. Similarly, the stream loader can resume play from the committed state stored by Kafka.
Discussion. One might contemplate the following simple solution is sufficient to support exactly-once guarantee. This solution also relies on the JanusGraph unique index. The solution can be illustrated by the following example:
g.addV("employee").property("employeeId", 104).property("company", "eBay).next()
Herein, “employee” is a graph label, and the property “employeeId” is the unique index key. This particular graph traversal will throw an exception if the vertex already exists and thus achieves exactly-once guarantee. However, for a batch transaction that involves multiple vertex inserts, this single-vertex graph traversal does not work any more, because if an earlier vertex in the traversal exists, the traversal will immediately throw an exception, thus causing later vertices to never get inserted, no matter how many retries it takes.
Model-Driven Graph Loading/Updating Pipeline
We have developed a generic model-driven Graph Extraction-Transformation-Load (ETL) pipeline that (1) processes different data sources; (2) extracts the to-be-loaded data to a set of key-value pairs; (3) transforms them into a subgraph including vertices and edges; and then (4) bulk loads them into NuGraph. Figure 9 illustrates the entire processing pipeline.
 Figure 9. Model-driven Graph Extraction-Transformation-Load Pipeline.
Extraction
The data is separated into chunks stored in multiple files. Shown in Figure 9, each data file has multiple lines of data, with the data format being defined via a separate layout file. The supported common layout formats include delimited, fixed-width, CSV, JSON, and Avro. It also supports hybrid and nested formats, such as combining delimited strings with JSON objects. The layout format instructs loaders on how to interpret data lines, for example, how to parse data at a specific position of a delimited string. When a graph loader processes a line, based on the defined layout, it extracts fields from the line and converts them to a set of key-value pairs.
Figure 10 provides an example of such conversion. The layout specifies that an input line is splitted into fields delimited by space characters. The first field is associated with the key “AccountId”, the second field is associated with the field “CreatedOn”. The third field is parsed as a JSON object. Its attribute values for “firstname”, “lastname”, and “registration_email” are associated with keys “RegFirstName”, “RegLastName”, “RegEmail”, respectively.
By having the layout configurable, loaders are flexible to interpret multiple data sources at runtime. The loaders also perform string normalizations on the values. Various string normalizations such as Trim, Uppercase, Lowercase, ReplaceAll, Prefix, etc., are supported. In Figure 10, the layout specifies normalizations for keys “CreatedOn”, “RegFirstName”, “RegLastName” and “RegEmail”. The values extracted from the data line is normalized accordingly as follows: (1) with key “CreatedOn”, its value is treated as date and converted to standard data time format of yyyy-MM-dd; (2) with key “RegFirstName”, its string value is uppercased, then adding a prefix “pp-“; (3) with key “RegLastName”, its string value is uppercased; and (4) with key “RegEmail”, its string value is lower-cased and adding a prefix “email-“.
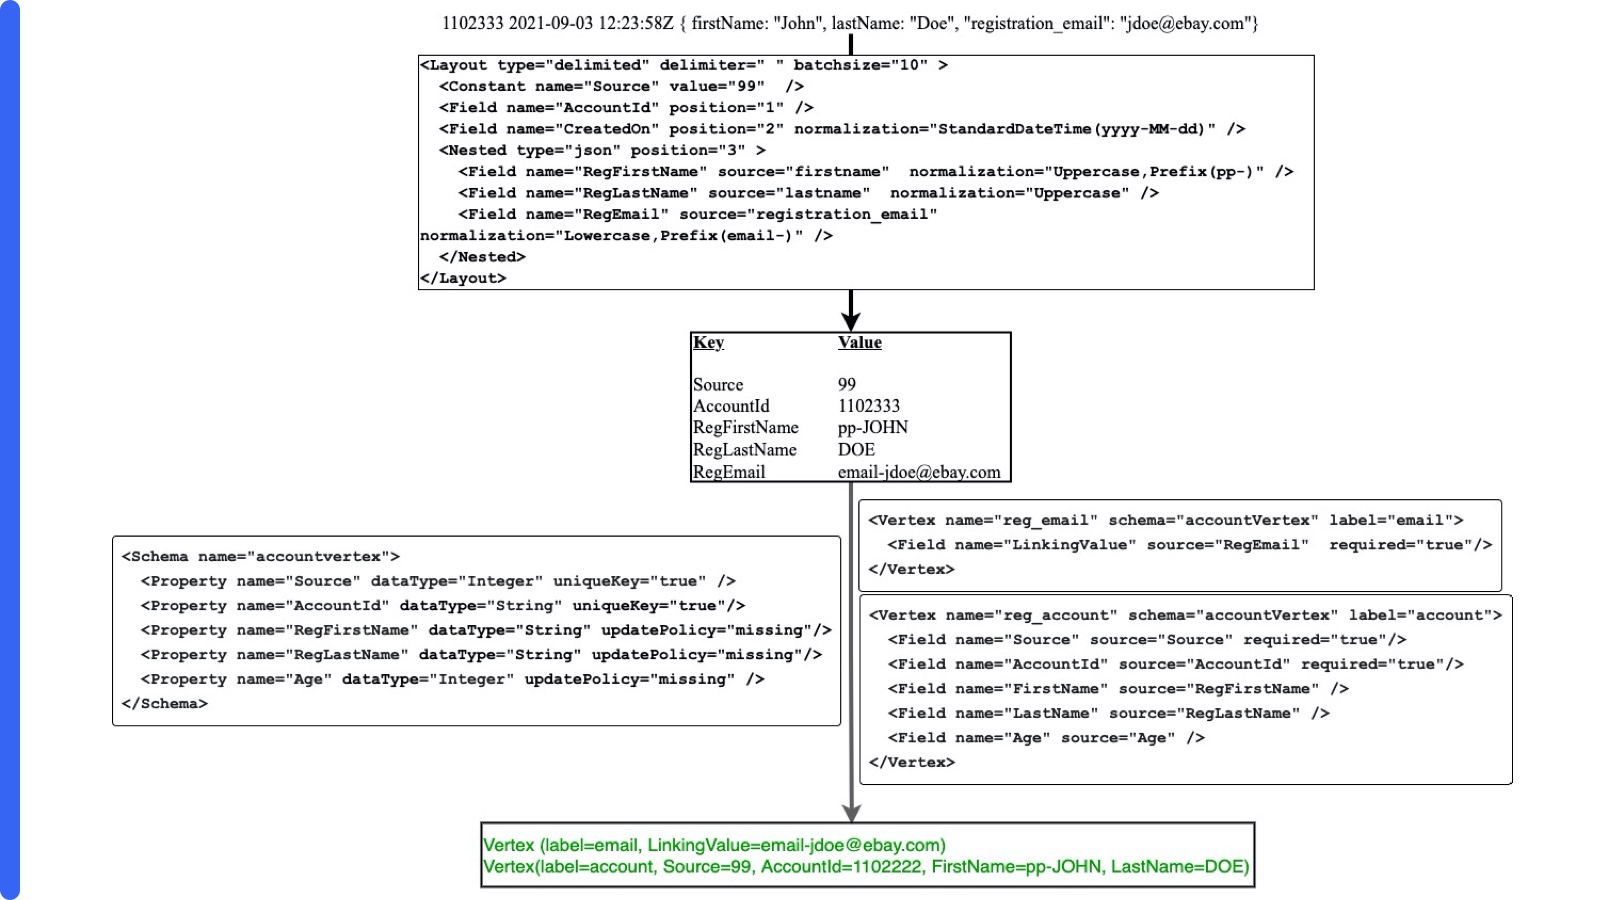 Figure 10. An example of a data line extracted and transformed to two vertices.
Transformation
Each loader is provided with a schema file (in the XML format) where it defines schema, and also schema matching rules for vertices and edges. Given the schema, the loader maps key-value pairs into to-be-loaded vertices and edges with the following rules:
- Rule 1: A vertex or an edge is only formed when all of their required property keys are presented in the key-value pairs, and
- Rule 2: With each vertex/edge formed at Rule 1, other properties found in the key-value pairs are added, based on the specified update policies that include: (a) update always, (b) add if missing, (c) never update, and (d) set the property to a new value based on a predicate involved with the new value and the existing value in the database, e.g., max(new value, existing value).
The output of this process is a to-be-loaded subgraph that includes a set of vertices and edges between them, along with the properties associated with these vertices and edges. Next we describe the schema and the schema matching rules in detail.
Schema
<Schema name="accountvertex">
<Property name="Source" dataType="Integer" uniqueKey="true" />
<Property name="AccountId" dataType="String" uniqueKey="true"/><Property name="Status" dataType="Integer" updatePolicy="always" />
<Property name="StatusChangeDate" dataType="Date" updatePolicy="always" />
<Property name="IsActive" dataType="Boolean" updatePolicy="always" />
<Property name="ChargeBackDate" dataType="Date" updatePolicy="max" />
<Property name="SuspensionReason" dataType="Integer" updatePolicy="always" />
<Property name="SuspensionDate" dataType="Date" updatePolicy="always" />
</Schema>
Figure 11 shows an example of schema definition. Each schema definition is given a name for subsequent referencing. Each property definition has the following attributes:
- name, corresponding to the property name in the graph.
- dataType, defining the data type to which a supplied string value must be converted to for insertion.
- uniqueKey, defining whether the property is part of the unique key used to identify a unique vertex.
- updatePolicy, specifying the policy for updating the property value. The policy options are always, never, min, max, or missing. The default is never.
Vertex Matching
With the schema definition introduced above, in order to construct vertices and edges, we need a mapping between the data line’s key-value pairs (from the extraction process already described) and the property names (from the schema definition). This mapping is defined in another XML block, as shown in Figure 12. Each vertex definition is given a name that is later referenced for edge creation. For each edge, we specify which vertex is the source and which is the target, using the name for identification (see Figure 13). The schema attribute indicates which schema definition is mapped to. Multiple vertices, for example, “account” and “alt-account”, can reference the same schema, “accountvertex”.
Note that the schema selected in Figure 12 is the one we named in Figure 11. The label attribute sets the label that will be applied to the vertex. The field tags map data keys for setting property values. For example, the property named Status shown in Figure 12 is set to the value paired with the key SuspensionStatus (resulted from the extraction process). When no value is available for a field its property will be ignored — either not created if the vertex is new, or unchanged if the vertex exists. However, if a field is tagged as required and no value is available, the vertex will not be created.
<Vertex name="account" schema="accountvertex" label="Account">
<Field name="Source" source="DataSource" required=”true” />
<Field name="AccountId" source="AccountId" required=”true” />
<Field name="Status" source="SuspensionStatus"/>
<Field name="StatusChangeDate" source="SuspensionStatusChangeDate" />
<Field name="IsActive" source="active" />
<Field name="ChargeBackDate" source="ChargeBackDate" />
<Field name="SuspensionReason" source="SuspensionReason" />
<Field name="SuspensionDate" source="SuspensionDate" />
</Vertex><Vertex name="alt-account" schema="accountvertex" label="Account">
<Field name="Source" source="DataSource" required=”true” />
<Field name="AccountId" source="AltAccounID" required=”true” />
</Vertex><Vertex name="ip_adress" schema="ipaddrvertex" label="IPAddress">
<Field name="LinkingValue" source="TranactionIPAddress” />
</Vertex>
Figure 12. Example of vertex definitions. Note that Account and Alt-Account use the same schema and label, but have different names and property value mappings.
Edge Matching
Now we show how to construct edges by specifying which vertices are linked and which data values are assigned to edge properties. An example of the XML to define an edge is shown in Figure 13. A directed edge has four attributes in total:
- source, the vertex from which the edge originates
- target, the vertex to which the edge terminates
- label, the label that is applied to the edge
- schema, the schema definition to be mapped
<Edge source="account" target="ip_address" label="Linking" schema="edge">
<Properties>
<Constant name="IsActive" value="true"/>
<Constant name="AttrSubType" value="ip_addr"/>
<Field name="CreatedOn" source="CreatedOn" />
</Properties>
</Edge><Edge source="alt-account" target="ip_address" label="Linking" schema="edge">
<Properties>
<Constant name="IsActive" value="true"/>
<Constant name="AttrSubType" value="ip_addr"/>
<Field name="CreatedOn" source="CreatedOn" />
</Properties>
</Edge>
Figure 13. Example of edge definitions and property value mapping.
Note that the source vertices selected in Figure 13 are the vertices named “account” and “alt-account”, and the target for both is the vertex named “p_address” from Figure 12.
The edge properties are likewise defined using a mapping from the key-value pairs extracted from a data line. Figure 13 shows an additional feature: values can be set to a constant instead of being mapped to a key.
Load
Given a set of key-value pairs that represent property keys and values, i.e., the result of the extraction process, with the above matching rules, a subgraph that is to be loaded or updated is constructed by the loader. In the subgraph, multiple vertices and edges between them are involved. The subgraph creation/update is expressed as a single graph traversal, i.e., a single transaction. The pseudo-code of this single graph traversal is described in Figure 14.
1    transaction start
2    for each vertex i:
3        v_i := Check if vertex exists using the unique key
4        if it does not exist:
5            v_i := Create a new vertex given its unique key
6        end if
7        Update v_i with its other properties
8    for each edge j:
9        {v_s, v_d} := Get the source vertex and destination vertex
10       e_j := Check if there is an edge from v_s to v_d with the same label
11       if it does not exist:
12           e_j := Create a new edge given the label
13       end if
14       Update e_j with its other properties
15    transaction commit
Figure 14. A single graph traversal as a transaction to load a subgraph.
The pseudo-code in Figure 14 combines the graph loading patterns described in Figure 5 (for vertices) and Figure 7 (for edges) (an example of it is at Figure 8). It is a batch transaction that involves multiple vertices and multiple edges. The batch size is configurable. If the batch size is too big, the total transaction time might exceed the five-second limit imposed by FoundationDB.
Correctness Validation of Loaded Data
Data validation is important to ensure that the graph is correctly loaded. Similar to the loading task described in the loading pipeline at Figure 9, the following steps are performed:
(1) A set of key-value pairs are extracted from the data line, following the described extraction process in Section 5; (2) Vertices and edges are retrieved based on their unique keys; and (3) Properties belonging to the vertices and edges are retrieved and compared against the key-value pairs extracted. Step two and step three are combined in a single graph traversal to retrieve the subgraph that validates multiple vertices and edges. The correctness validation can be done as part of the pipeline, i.e., right after the subgraph was loaded, or it can be done separately after the whole graph is loaded.
To reduce the validation time, one may choose to validate statistically a small portion of the graph. A simple sampling-based solution can be applied on the vertices identified in each of the data files. By default, data validation retrieves the entire graph to validate, which provides an absolute result but may take a long time to run. To reduce the validation time, one may choose to validate statistically a small percentage of the total number of subgraphs. While it does not provide the absolute correctness guarantee, it can provide some degrees of confidence on the loaded data.
Production Deployment Status
GraphLoad has been developed and put into production since May 2020, with focus on a user-account related graph database. The total graph has over 15 billion vertexes and over 20 billion edges. The total storage at the backend FoundationDB database (with six data copies) is about 36 TB. The daily traffic is between 1,000 and 5,000 transactions per second for the batch loaders. Each transaction performs the load/update of a subgraph with an average of 15 vertices (including the associated edges and properties). The daily total loading time is between two to 10 hours. Note that this reported processing rate is limited by the actual eBay site-facing real-time traffic, not because of the fundamental limits of the deployed NuGraph cluster’s processing capacity. The total loader instances can be dynamically scaled up easily when the data volume to be loaded is increased. In one case, we loaded at a sustained rate of 2.5 billions per day for several days, with 200 loader instances launched in total.
The loaded data gets continuously queried by other graph applications linked with the NuGraph Client Library. In this particular user-account related graph database, the queries are read-only queries over a consistent snapshot of the backend FoundationDB database.
Conclusions
We have developed a scalable graph loader called GraphLoad to load and update graphs at scale. GraphLoad was successfully deployed in production to load the graph with over 15-billion vertices and over 20-billion edges, at real-time and at batch.
The size of the graph has continued to grow since November 2020 when we did the last comprehensive check on the graph size. GraphLoad performs parallel loading and can be scaled to hundreds of loaders located in two data centers, enabled by scalability and high availability of NuGraph.
GraphLoad provides a generic solution to construct graph operation commands that can load different source data layouts and graph schemas. The same loading framework allows the loaded data to be validated to ensure data qualities. It guarantees exactly-once loading and updating logic under various failure conditions, supported by the distributed transaction from NuGraph service layer and FoundationDB storage engine.
References
[1] Kafka Consumer Configuration, https://docs.confluent.io/platform/current/clients/consumer.html
[2] J. Zhou, M. Xu, A. Shraer, etc, FoundationDB: A Distributed Unbundled Transactional Key Value Store, SIGMOD/PODS ’21: Proceedings of the 2021 International Conference on Management of Data, June 2021, https://doi.org/10.1145/3448016.3457559.
[3] FoundationDB online document, https://apple.github.io/foundationdb/
[4] FoundationDB Configuration, https://apple.github.io/foundationdb/configuration.html#configuring-regions
[5] JanusGraph online documentation, https://docs.janusgraph.org/
