Grab’s real-time data platform team, Coban, has been running its stream processing framework on Kubernetes, as detailed in Plumbing at scale. We’ve also written another article (Scaling Kafka consumers) about vertical pod autoscaling (VPA) and the benefits of using it.
In this article, we cover the performance bottlenecks and other issues we came across for Go applications on Kubernetes.
Background
We noticed CPU throttling issues on some pipelines leading to consumption lag, which meant there was a delay between data production and consumption. This was an issue because the data might no longer be relevant or accurate when it gets consumed. This led to incorrect data-driven conclusions, costly mistakes, and more.
While debugging this issue, we focused primarily on the SinktoS3 pipeline. It is essentially used for sinking data from Kafka topics to AWS S3. Depending on your requirements, data sinking is primarily for archival purposes and can be used for analytical purposes.
Investigation
After conducting a thorough investigation, we found two main issues:
- Resource throttling
- Issue with VPA
Resource throttling
We redesigned our SinktoS3 pipeline architecture to concurrently perform the most CPU intensive operations using parallel goroutines (workers). This improved performance and considerably reduced consumer lag.
But the high-performance architecture needed more intensive resource configuration. As mentioned in Scaling kafka consumers, VPA helps remove manual resource configuration. So, we decided to let the SinktoS3 pipeline run on VPA, but this exposed a new set of problems.
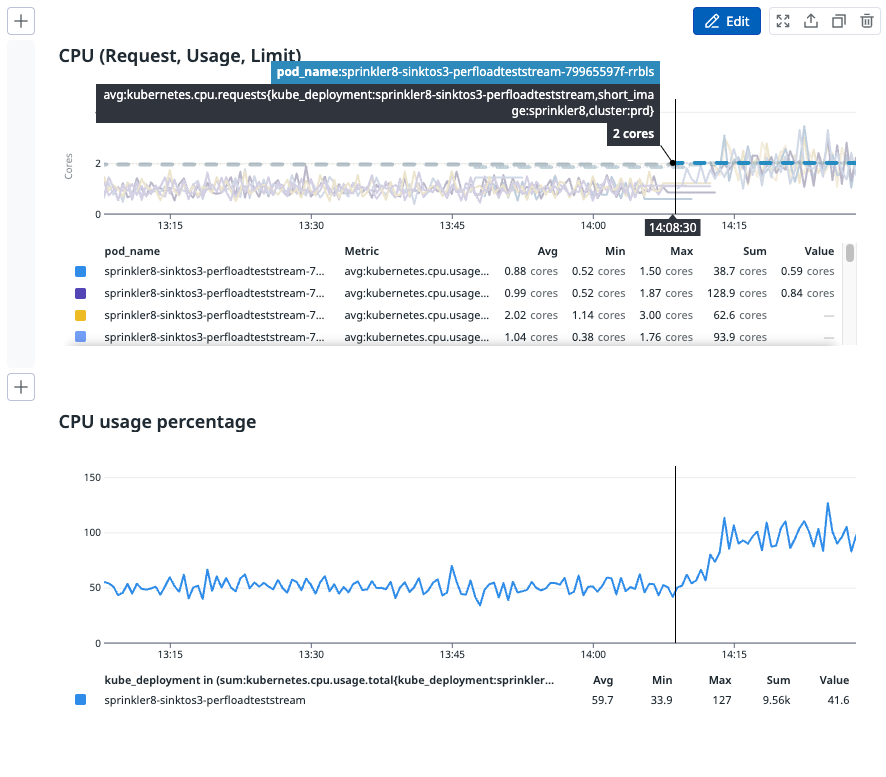
We tested our hypothesis on one of the highest traffic pipelines with parallel goroutines (workers). When the pipeline was left running on VPA, it tried optimising the resources by slowly reducing from 2.5 cores to 2.05 cores, and then to 1.94 cores.

As you can see from the image above, CPU usage and performance reduced significantly after VPA changed the CPU cores to less than 2. The pipeline ended up with a huge backlog to clear and although it had resources on pod (around 1.94 cores), it did not process any faster and instead, slowed down significantly, resulting in throttling.
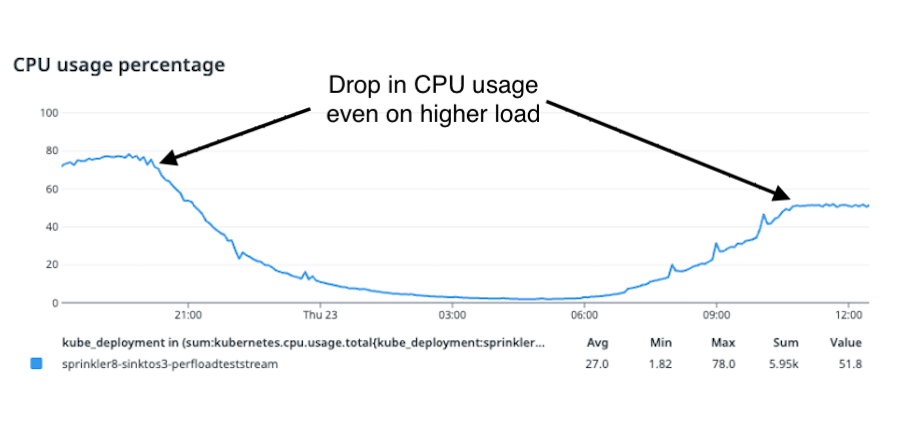
From the image above, we can see that after VPA scaled the limits of CPU down to 1.94 cores per pod, there was a sudden drop in CPU usage in each of the pods.
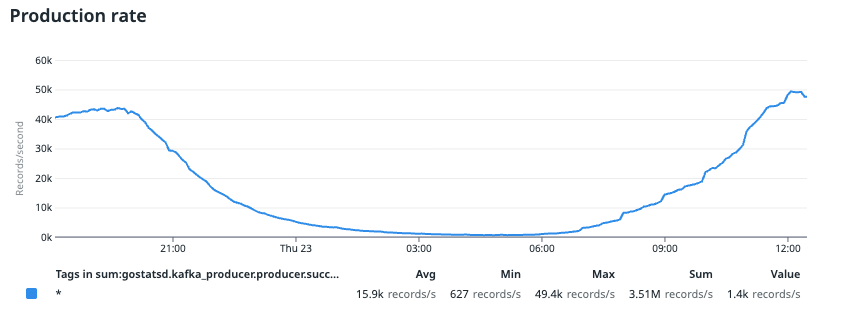
You can see that at 21:00, CPU usage reached a maximum of 80%. This value dropped to around 50% between 10:00 to 12:00, which is our consecutive peak production rate.
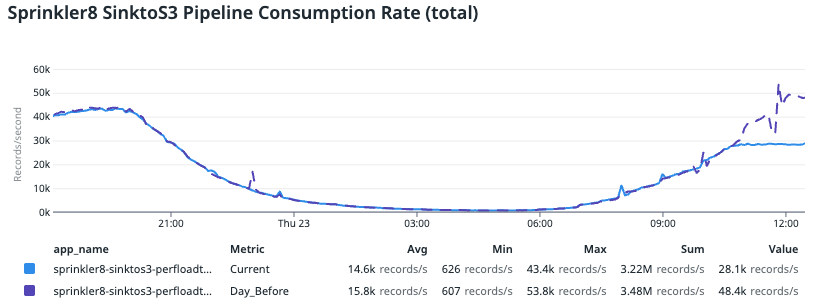
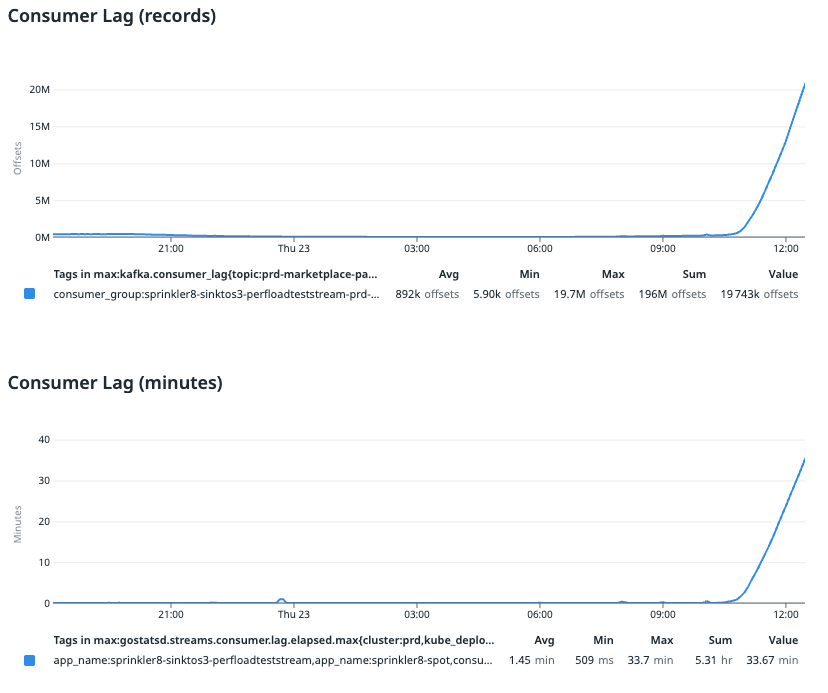
In the image above, we compared this data with trends from previous data, where the purple line indicates the day before. We noticed a significant drop in consumption rate compared to the day before, which resulted in consumer lag. This drop was surprising since we didn’t tweak the application configuration. The only change was done by VPA, which brought the CPU request and limit down to less than 2 cores.
To revert this change, we redeployed the pipeline by retaining the same application setting but adjusting the minimum VPA limit to 2 cores. This helps to prevent VPA from bringing down the CPU cores below 2. With this simple change, performance and CPU utilisation improved almost instantly.
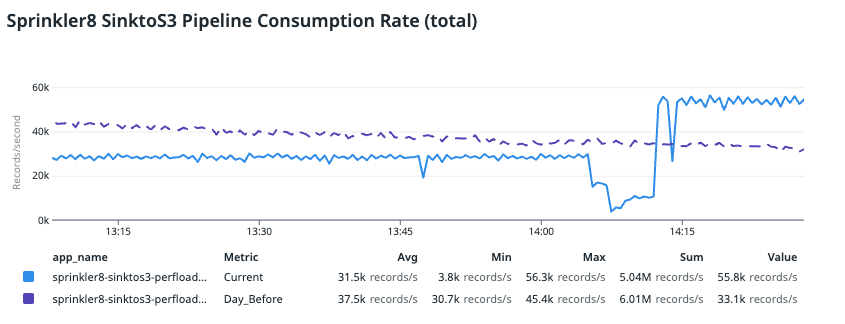
In the image above, we compared the data with trends from the day before (indicated in purple), where the pipeline was lagging and had a large backlog. You can see that the improved consumption rate was even better than the day before and the application consumed even more records. This is because it was catching up on the backlog from the previous consumer lag.
Deep dive into the root cause
This significant improvement just from increasing CPU allocation from 1.94 to 2 cores was unexpected as we had AUTO-GOMAXPROCS enabled in our SPF pipelines and this only uses integer values for CPU.
Upon further investigation, we found that the GOMAXPROCS is useful to control the CPU that golang uses on a kubernetes node when kubernetes Cgroup masks the actual CPU cores of the nodes. GOMAXPROCS only allocates the requested resources of the pod, hence configuring this value correctly helps the runtime to preallocate the correct CPU resources.
Without configuring GOMAXPROCS, go runtime assumes the node’s entire CPU capacity is available for its execution, which is sub-optimal when we run the Golang application on Kubernetes. Thus, it is important to configure GOMAXPROCS correctly so your application pre-allocates the right number of threads based on CPU resources. More details can be found in this article.
Let’s look at how Kubernetes resources relate to GOMAXPROCS value in the following table:
| Kubernetes resources | GOMAXPROCS value | Remarks |
|---|---|---|
| 2.5 core | 2 | Go runtime will just take and utilise 2 cores efficiently. |
| 2 core | 2 | Go runtime will take and utilise the maximum CPU of the pod efficiently if the workload requires it. |
| 1.5 core | 1 | AUTO-GOMAXPROCS will set the value as 1 since it rounds down the non-integer CPU value to an integer number. Hence the performance will be the same as if you had 1 core CPU. |
| 0.5 core | 1 | AUTO-GOMAXPROCS will set the value as 1 CPU as the minimum allowed value for GOMAXPROCS is 1. Here we will see some throttling as Kubernetes will only give 0.5 core but runtime configures itself as it would have 1 hence it will starve for a few CPU cycles. |
Issue with VPA
The vertical pod autoscaler enables you to easily scale pods vertically so you don’t have to make manual adjustments. It automatically allocates resources based on usage and allows proper scheduling so that there will be appropriate resources available for each pod. However, in our case, the throttling and CPU starvation issue was because VPA brought resources down to less than 2 cores.
To better visualise the issue, let’s use an example. Assume that this application needs roughly 1.7 cores to perform all its operations without any resource throttling. Let’s see how the VPA journey in this scenario looks like and where it will fail to correctly scale.
| Timeline | VPA recommendation | CPU Utilisation | AUTO-GOMAXPROCS | Remarks |
|---|---|---|---|---|
| T0 | 0.5 core | >90% | 1 | Throttled by Kubernetes Cgroup as it does give only 0.5 core. |
| T1 | 1 core | >90% | 1 | CPU utilisation will still be >90% as GOMAXPROCS setting for the application remains the same. In reality, it will need even more. |
| T2 | 1.2 core | <85% | 1 | Since the application actually needs more resources, VPA sets a non-integer value but GOMAXPROCS never utilised that extra resource and continued to throttle. Now, VPA computes that the CPU is underutilised and it won’t scale further. |
| T3 | 2 core (manual override) | 80-90% | 2 | Since the application has enough resources, it will perform most optimally without throttling and will have maximum throughput. |
Solution
During our investigation, we saw that AUTO-GOMAXPROCS sets an integer value (minimum 1). To avoid CPU throttling, we need VPA to propose integer values while scaling.
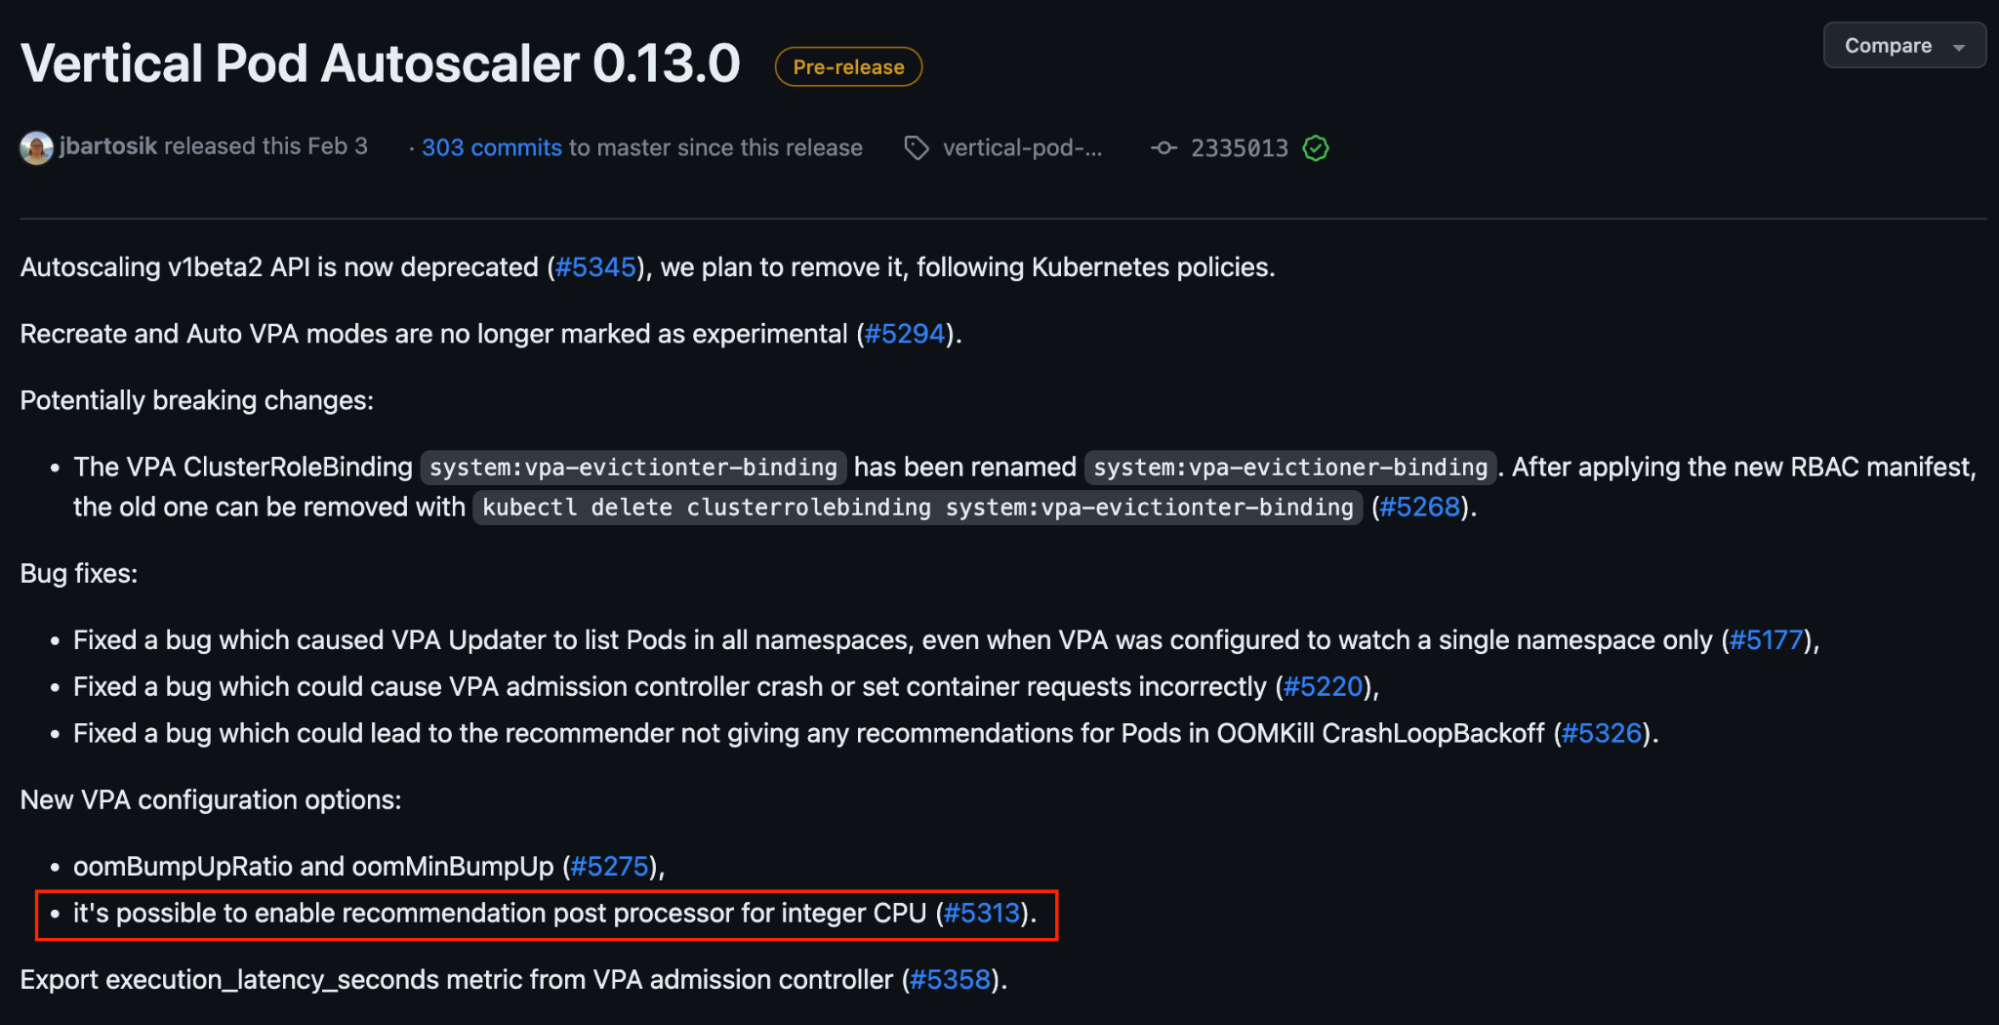
In v0.13 of VPA, this feature is available but only for Kubernetes versions ≥1.25 – see #5313 in the image below.
We acknowledge that if we define a default minimum integer CPU value of 1 core for Coban’s stream processing pipelines, it might be excessive for those that only require less than 1 core. So we propose to only enable this default setting for pipelines with heavy resource requirements and require more than 1 core.
That said, you should make this decision by evaluating your application’s needs. For example, some Coban pipelines still run on VPA with less than one core but they do not experience any lag. As we mentioned earlier AUTO-GOMAXPROCS would be configured to 1 in this case, still they can catch up with message production rates. However, technically these pipelines are actually throttled and do not perform optimally but these pipelines don’t have consumer lag.
As we move from single to concurrent goroutine processing, we need more intensive CPU allocation. In the following table, we consider some scenarios where we have a few pipelines with heavy workloads that are not able to catch up with the production rate.
| Actual CPU requirement | VPA recommendation (after upgrade to v0.13) | GOMAXPROCS value | Remarks |
|---|---|---|---|
| 0.8 | 1 core | 1 | Optimal setting for this pipeline. It should not lag and should utilise the CPU resources optimally via concurrent goroutines. |
| 1.2 | 2 | 2 | No CPU throttling and no lag. But not very cost efficient. |
| 1.8 | 2 | 2 | Optimal performance with no lag and cost efficiency. |
Learnings/Conclusion
From this experience, we learnt several things:
- Incorrect GOMAXPROCS configuration can lead to significant throttling and CPU starvation issues.
- Autoscaling solutions are important, but can only take you so far. Depending on your application needs, manual intervention might still be needed to ensure optimal performance.
Grab is the leading superapp platform in Southeast Asia, providing everyday services that matter to consumers. More than just a ride-hailing and food delivery app, Grab offers a wide range of on-demand services in the region, including mobility, food, package and grocery delivery services, mobile payments, and financial services across 428 cities in eight countries.
Powered by technology and driven by heart, our mission is to drive Southeast Asia forward by creating economic empowerment for everyone. If this mission speaks to you, join our team today!

