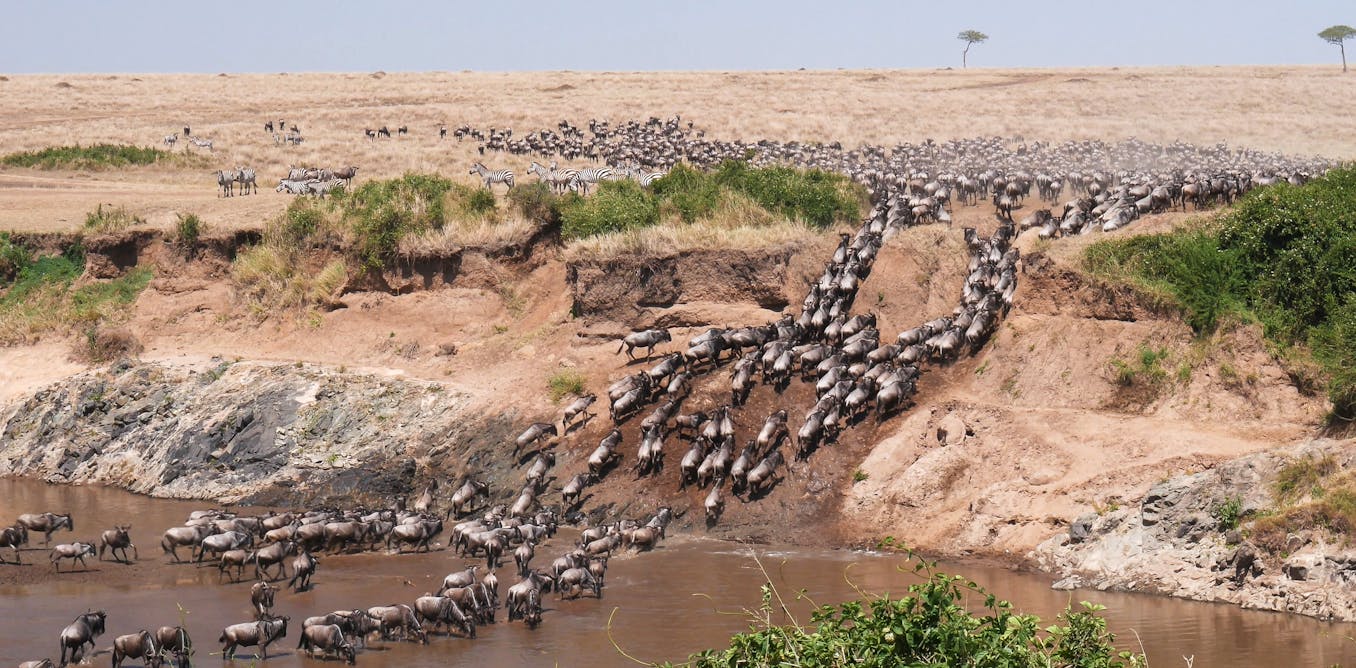
The Great Wildebeest Migration is one of the most remarkable natural spectacles on Earth. Each year, immense herds of wildebeest, joined by zebras and gazelles, travel 800-1,000km between Tanzania and Kenya in search of fresh grazing after the rains.
This vast, circular journey is the engine of the Serengeti-Mara ecosystem. The migration feeds predators such as lions and crocodiles, fertilises the land and sustains the grasslands. Countless other species, and human livelihoods tied to rangelands and tourism, depend on it.
Because this migration underpins the entire ecosystem, it’s vital to know how many animals are involved. A change in numbers would not only affect wildebeest, but would ripple outward to predators, vegetation and the millions of people who rely on this landscape.
For decades, aerial surveys have been the main tool for estimating the size of east Africa’s wildebeest population. Aircraft fly in straight lines (transects) a few kilometres apart and use these strips to estimate the total population. This dedicated and arduous work, using a long-established method, has given us an estimate of about 1.3 million wildebeest.
In recent years, conservation scientists have begun testing whether satellites and artificial intelligence (identifying patterns in large datasets) can offer a new way to monitor wildlife. Earlier work showed that other species – Weddell seals, beluga whales and elephants – could be identified in satellite imagery using artificial intelligence.
In 2023, we showed that migratory wildebeest could be detected from satellite images using deep learning. That study proved it’s possible to monitor large gatherings of mammals from space. The next step has been to move from simply detecting animals to estimating their populations – using satellites not just to spot them, but to count them at scale.
Our recent study was carried out through collaboration between biologists, remote sensing specialists and machine-learning scientists. We analysed satellite imagery of the Serengeti-Mara ecosystem from 2022 and 2023, covering more than 4,000km².
Using deep learning models
The images were collected at very high spatial resolution (33-60cm per pixel), with each wildebeest represented by fewer than nine pixels. We analysed the imagery using two complementary deep learning models: a pixel-based U-Net and an object-based YOLO model. Both were trained to recognise wildebeest from above. Applying them together allowed us to cross-validate detections and reduce potential bias. The images were taken at the beginning and end of August, corresponding to different stages of the dry-season migration. Smaller herds were observed earlier in the month, as expected.
Across both years, the models detected fewer than 600,000 wildebeest within the dry-season range. While these numbers are lower than some previous aerial estimates, this should not necessarily be interpreted as evidence of a population decline, and we encourage more surveying effort to work out the relative error biases in each approach. While some animals are inevitably missed, under trees or outside the imaged area, it is unlikely that such factors could account for hundreds of thousands more. To confirm that the main herds were covered, we validated the survey extent using GPS tracking data from collared wildebeest and ground-based observations from organisations monitoring herd movements in the region.
These results provide the first satellite-based dry-season census of the Serengeti-Mara migration. Rather than replacing aerial surveys, they offer a complementary perspective on seasonal population dynamics. The next step is to coordinate aerial and satellite surveys in parallel. This way each method can help refine the other and build a more complete picture of this extraordinary migration.
Future directions
Satellite monitoring is not a panacea. Images are expensive, sometimes obscured by cloud cover. And they can never capture every individual on the ground (neither can aerial surveys). But the advantages are compelling. Satellites can capture a snapshot of vast landscapes at a single moment in time, removing much of the uncertainty that comes from extrapolating localised counts.
The approach is scalable to many other species and ecosystems. And as more high-resolution satellites (capable of imaging at less than 50cm) are launched, we can now revisit the same spot on Earth multiple times a day, bringing wildlife monitoring closer to real time than ever before.
Beyond population counts, satellites also open up a new scientific frontier: the study of collective movement at scale. The wildebeest migration is a classic case of emergent behaviour: there is no leader, yet order still arises. Each animal follows simple cues like where the grass is greener or where a neighbour is moving, and together thousands create a vast, coordinated journey.
With high-resolution satellite data, scientists can now explore the basic physics that shape how animals move together in large groups. But how do density waves of movement propagate across the landscape, what scaling rules might be governing patterns of spacing and alignment, and how do these collective patterns influence the functioning of ecosystems?
Our findings demonstrate how satellites and AI can be harnessed not only for wildlife population monitoring but also for applications that extend beyond population counts to uncovering the mechanisms of collective organisation in animal groups.
![]()
Isla C. Duporge received funding support from the National Academy of Sciences (NAS) while leading this research. The imagery used in the project was acquired via her fellowship with NAS.
Daniel Rubenstein, David Macdonald, and Tiejun Wang do not work for, consult, own shares in or receive funding from any company or organisation that would benefit from this article, and have disclosed no relevant affiliations beyond their academic appointment.