As large-scale distributed microservice systems continue to power more of today’s businesses, it has become even more important to detect any anomalies in these systems and efficiently diagnose their root causes to ensure high system availability.
To diagnose any root causes, existing approaches have usually consisted of capturing information about the state of the system by instrumentation or monitoring metrics. Then, with techniques such as machine learning or heuristics, these approaches abstract the root cause analysis (RCA) problem into logical constraints or a dependency/causality graph. Graph models are popular since they can represent the dependencies/causalities between different components in a system. Existing work has already attempted approaches based on probabilistic graphical models to describe the states of the system.
How Groot Helps Overcome Microservice Architecture Challenges
Microservice architecture has been proposed and quickly adopted by many large companies to improve the scalability, development agility and reusability of their business systems. However, despite these undeniable benefits, microservice architecture also brings three new challenges in reliability:
- Operational Complexity: For large-scale systems, there are typically two major categories of Site Reliability Engineers (SREs), namely centered/infrastructure SREs and embedded/domain SREs. The former category of SREs focuses on a reliable infrastructure, but might be less familiar with specific services and therefore might not be able to quickly adapt to new changes. The latter category of SREs has domain and product knowledge, but likely spends additional effort on duplicate infrastructure work due to lack of knowledge sharing and mobility.
- Scale Complexity: There can be thousands of services simultaneously running in microservices systems. As a result, dependencies between services are proportionally more complicated than in traditional systems. Detecting root causes that are distributed in a domain or many steps away from an initially observed anomalous service is harder than ever.
- Monitoring Complexity: Numerous data types and a high quantity of data points (metrics/logs/activities) need to be monitored, stored and processed in services, such as intra-service and inter-service metrics. Different services in a system may produce different types of logs. There are also different developer activities — such as code deployment or configuration changes (which is much more frequent in microservices architecture) — that require special management in RCA systems.
To overcome these challenges, we present Groot, a graph-based framework for root cause analysis in a large microservice system. Groot has two main highlights over existing approaches:
- Fine granularity (events as basic nodes): Instead of the commonly used service or hosts (VM) as the basic nodes of the causality graph, Groot constructs the causality graph by using monitoring events as basic nodes. Graphs based on events from the services can provide more accurate results to address the monitoring complexity. For the scale complexity, Groot can dynamically create hidden events or additional dependencies based on the context, such as adding dependencies to the external service providers and their issues. Furthermore, to construct the causality graph, Groot takes the detailed contextual information of each event into consideration for deeper analysis. Doing so also helps Groot incorporate SRE insights with the context details of each event to address the operational complexity.
- High diversity (a wide range of event types supported): The causality graph in Groot supports various event types, such as performance metrics, status logs and developer activities to address the monitoring complexity. This multi-scenario graph schema can directly boost RCA coverage and precision. For example, Groot is able to detect a specific configuration change on a service as the root cause instead of a performance anomaly symptom, thus reducing live efforts and time to recovery (TTR). Groot also allows the SRE developers to introduce different event types that are powered by different detection strategies or from different sources. For the rules that decide causality between events, we designed a grammar that allows easy and fast implementations of domain-specific rules, narrowing the knowledge gap of the operational complexity. Lastly, Groot provides a robust and transparent ranking algorithm that can digest diverse events, improve accuracy and produce results interpretable by visualization.
Approach to Designing Groot
Figure 1 shows the overall workflow of Groot. The triggers of Groot are usually the automated anomaly detection alert(s), or sometimes the SRE engineer’s suspicion. There are three major steps: service dependency graph construction, event causality graph construction and root cause ranking. The outputs are the root causes ranked by likelihood. To support a fast investigation experience, we built an interactive user interface: the application dependency, events with causal links and additional details (such as raw metrics or developer contact for code-deployment events) are presented to the user for next steps. Here’s an example of how this looks in deployment while actively being used by a TDO (Technical Duty Officer) and SRE teams for live incident triaging:

For the offline part of investigation, we label and collect the data set, perform validation and summarize the knowledge for further improvement on all incidents on a daily basis.
Example of Groot in Action
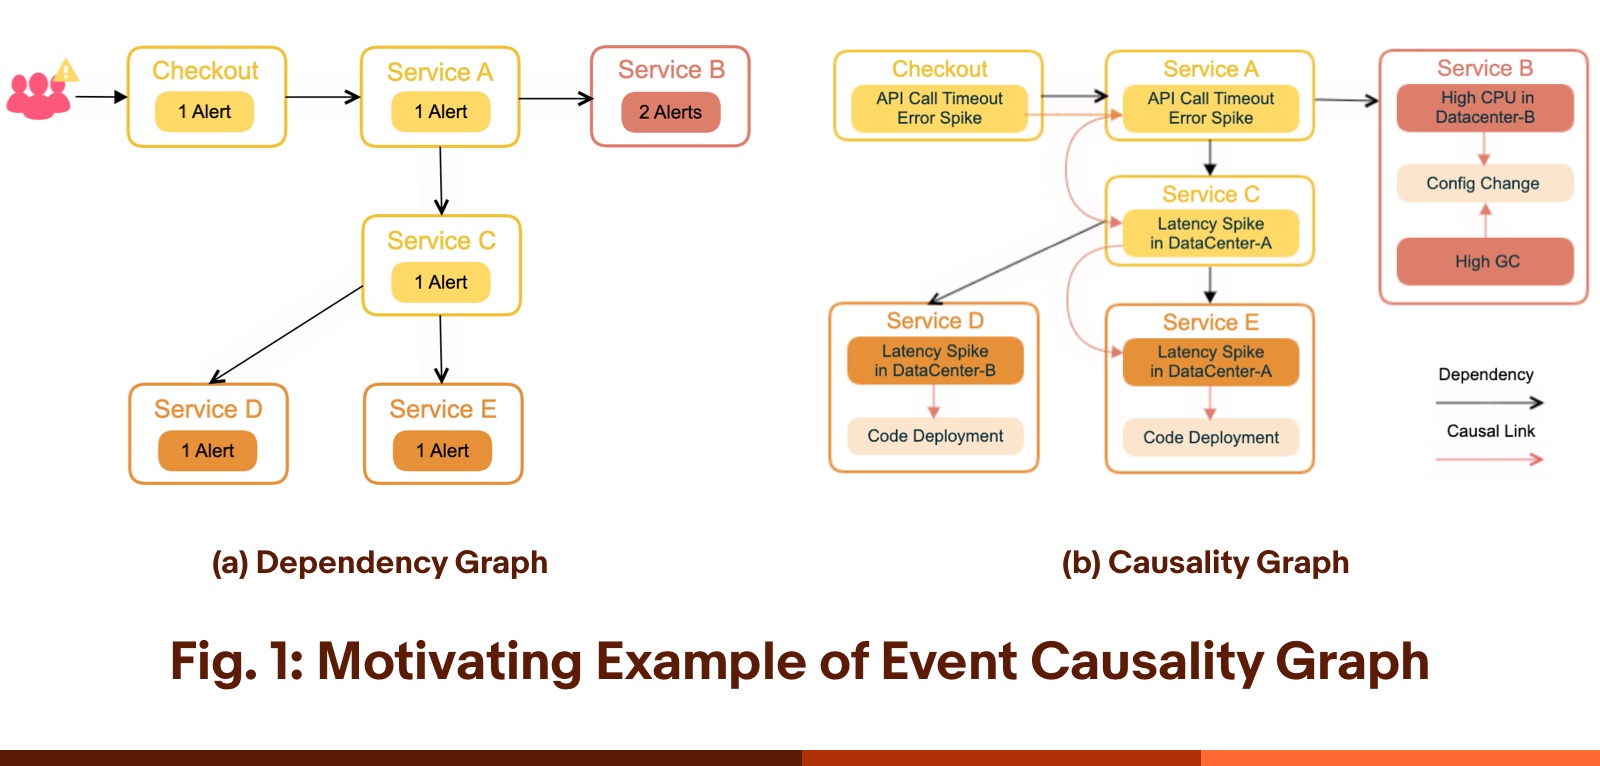
Figure 2 shows a simplified example of the dependency graph and the corresponding causality graph constructed by Groot. If eBay Checkout service suddenly experienced additional latency while responding to user requests, the service monitor would report an API Call Timeout, which is detected by the anomaly detection system. The initial alert is triggered on the Checkout (entrance) service. The other nodes are the internal services that the Checkout service directly or indirectly depends on. The color of the nodes in Figure 2 indicates the severity/count of anomalies (alerts) reported on each service. We can see that Service B is the most severe, since there are two related alerts on it. The traditional graph-based approach usually takes into account only the causality graph between services and the severity information on each service. If the traditional approach were applied on Figure 2, we can see that Service B, Service D or Service E could be a potential root cause.
In contrast, using Groot, developers are able to further construct the event-based causality graph. We can see from the figure that the API Call Timeout issue in Checkout is possibly caused by an API Call Timeout in Service A, which is further caused by a Latency Spike in Service C. This Latency Spike happens in DataCenter-A. Groot further investigates and finds the issue is likely caused by a Latency Spike in Service E, which happens in the same data center. Finally, Groot figures out that the most probable root cause is a recent Code Deployment event in Service E.
There are no links in the causality graph between events in Service B and Service A because the API Call Timeout event is less likely to depend on the event type High CPU and High GC. Therefore, the inference can eliminate Service B from possible root causes. This elimination shows the benefit of the event-based graph. Note, there is another event Latency Spike in Service D, but not connected to the Latency Spike in Service C in the causality graph. The reason is that the Latency Spike event happens in DataCenter-A, not DataCenter-B, so even though both events are Latency Spikes and related, they would not connect in Groot’s causality graph since they do not happen in the same data center.
Evaluation of Results
To allow us to evaluate Groot in a real-world scenario, Groot is deployed and tested in eBay which serves hundreds of millions of consumers every day. The system is built upon a microservice architecture that contains more than 5,000 microservices deployed in three data centers. The distributed tracing of the system generates 147 billion traces with 2.8 trillion spans on average per day. These microservices are built on different tech stacks with different programming languages, including Java, Python and Node.js. Furthermore, these microservices interact with each other by using different types of service protocols, including HTTP, gRPC and Message Queue. The busiest services in the system have over 50,000 TPS (transactions per second) every day.
We designed and implemented two baseline approaches to represent state-of-the-art methodologies in our framework:
- Naive Dependency Approach: The naive approach does not use events as the nodes in the graph. Instead, it directly uses the service dependency graph.
- Non-adaptive Event Approach: This approach does construct the event causality graph; however, it does not include conditional and dynamic rules.

RQ1: What is the RCA accuracy and performance of Groot in the collected dataset?
Groot achieves high accuracy on service-based and business domain incidents. In service-based incidents, Groot is able to achieve 100% top-three accuracy, which means engineers only need to check the top three events to find the correct root cause.
RQ2: How does the adaptive event-driven approach help improve the accuracy of Groot compared with baseline approaches?
We can see the accuracy of Groot is substantially higher than both the Naive and Non-adaptive baselines.
RQ3: What is the RCA accuracy and performance of Groot in an end-to-end real-time scenario?

Groot is currently deployed in production, helping to detect and confirm root causes while boosting triage speed.
Lessons Learned
Using Groot in production environments has provided helpful experiences and takeaways in the realm of technology transfer and adoption.
- Embedded in Practice: For an RCA tool to be successful, it must be embedded in the R&D work taking place in the live environment by users and SRE experts. For this work, we closely partner with the SRE and monitoring teams: Holding routine meetings with the SRE team to manually test and review every site incident; providing support resources and ongoing opportunities for training; and actively reaching out to users for feedback have been important for the tool’s adoption.
- Vertical Enhancements: Empowering great experiences through vertical enhancements increases the tool’s user base and utility. From grouping related alerts across applications and critical business domain issues, to integrating anomaly and diagnostic reporting with workplace communication apps, most of Groot’s adoption has been driven by providing helpful features which solve a business challenge.
- Data and Tool Reliability: Ensuring a robust back end — such as partial and dynamic retry logic, a high-efficiency cache and tracing components — is key for user confidence. To ensure the engineering team has faith in Groot’s results, every request can be traced back to atomic actions, such as retrieving data, data cleaning and anomaly detection via algorithms.
- Trade-off Among Models: Balancing aspects such as accuracy, adaptability, scalability, performance, effort and robustness requires careful consideration and testing. For Groot, we set different “acceptance” levels by analyzing each event’s impact and frequency, and then testing different models in staging to select the best fit.
- Phased Incorporation of ML: ML-powered RCA products currently require ongoing supervision and adaptation by an engineering team. However, Groot is designed to be easily infused with SRE knowledge so that it can achieve high effectiveness and efficiency over time. While this learning is in process, Groot leverages knowledge engineering and graph capabilities to provide the engineering team with transparency into its logic and to help inspire confidence in its results. Moving forward, we have built and validated a white-box, deep-learning approach with causal graph algorithms, where the causal link weights are parameters and derivable. In the new approach, the causal links can be learned with better accuracy and minimize manual configurations.
Conclusions
Groot’s novel, event-driven and graph-based approach constructs a causality graph between events instead of a traditional dependency graph between applications. This allows adaptive customization of rules for building causality links. We integrated Groot into a large-scale distributed system containing more than 5,000 microservices. We analyzed a dataset consisting of 952 real-world incidents collected from the system deployment and equipped with manually-labeled root causes. Evaluation results showed that our approach achieves great performance in both accuracy and efficiency across different scenarios, and also largely outperforms baseline graph-based approaches.
For more details and to read the full article written in partnership with University of Illinois Urbana-Champaign and Peking University, check out this paper.
